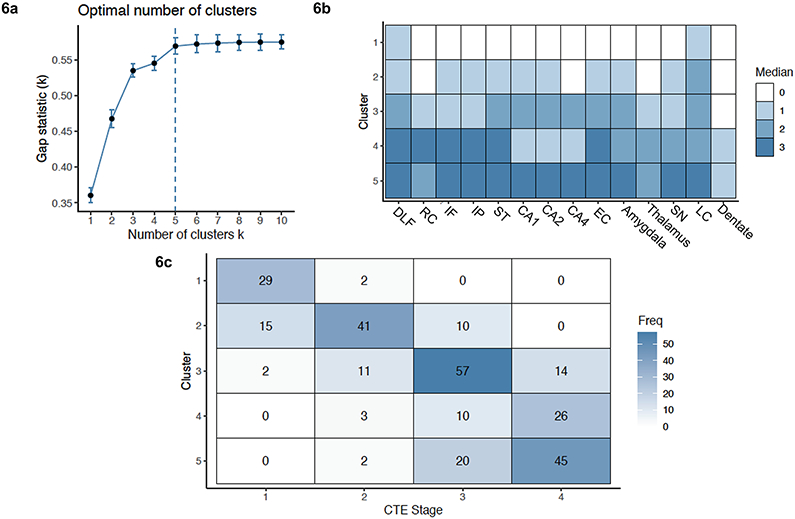
Fig. 6. K-Medoids Cluster Analysis of 14 Semi-Quantitative Rating Scales of Regional P-tau Pathology and their Association with CTE Stage.
A k-medoids cluster analysis with the 14 semi-quantitative rating scales was conducted to determine the different patterns of regional p-tau deposition and to ascertain how these patterns differed by CTE stage. (6a) Using the Gap Statistic method, 5 clusters best fitted the data. (Ten cluster sizes were examined. After 5 clusters, there was minimal difference between the clusters). (6b) Heat map of the medoids of each cluster. The 14 brain regions on the x-axis are those that were rated for p-tau severity using a 0-3 scale, with 0 being none and 3 being severe p-tau involvement. The 5 clusters are represented on the y-axis. The median score of p-tau severity for each brain region is graphed using the shown color scale; darker colors reflecting more severe p-tau. (6c) Association of cluster assignment and CTE stage.
Abbreviations: DLF = dorsolateral frontal cortex; RC = Rolandic cortext; IF = inferior orbitofrontal cortex; IP = inferior parietal cortex; ST = superior temporal cortex; EC = entorhinal cortex; SN = substantia nigra; LC = locus coeruleus

