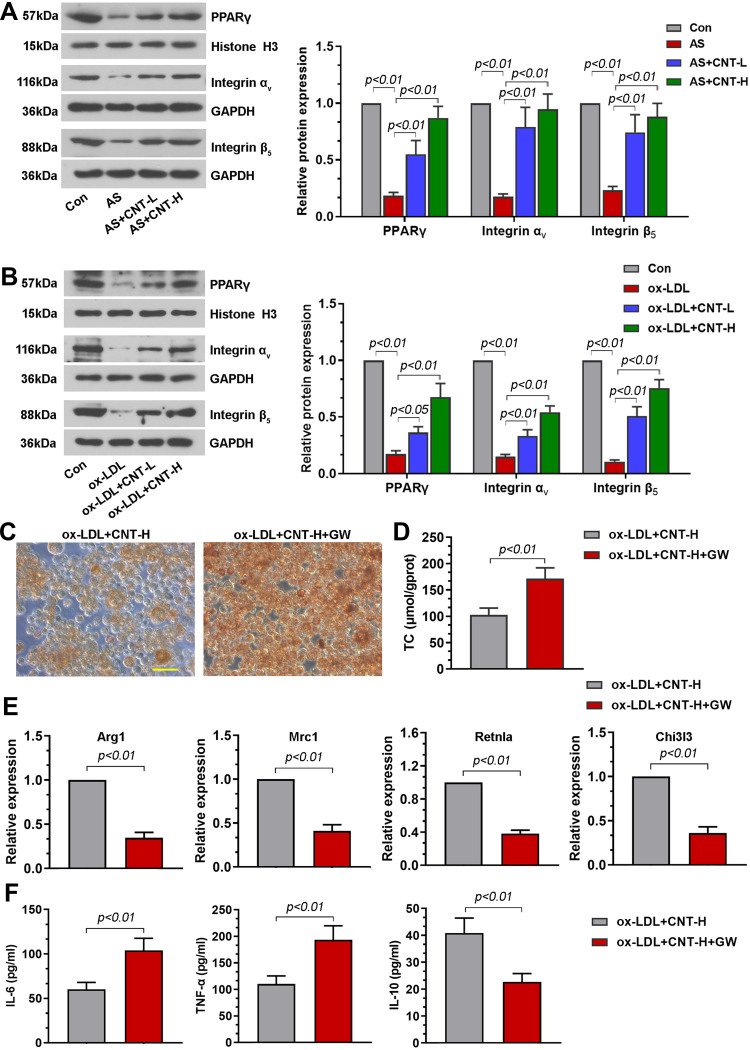
Figure 6.
PPARγ antagonist, GW9662, blocked CNT-enhanced M2 macrophage polarization. (A and B) Western blot analysis and quantification of PPARγ, Integrin αv and Integrin β5 in the aortic tissues (A) and RAW264.7 cells (B). (C) Representative images of Oil red O staining in macrophages. Bar=50 μm. (D) Levels of TC in cells were measured by available kits. (E) Arg1, Mrc1, Retnla and Chi3l3 mRNA levels were assessed by qPCR. (F) IL-6, TNF-α and IL-10 contents in cell supernatants were tested using ELISA. Data were expressed as mean ± SD.
Abbreviations: Con, control; CNT-L, low dose of CNT; CNT-H, high dose of CNT.

