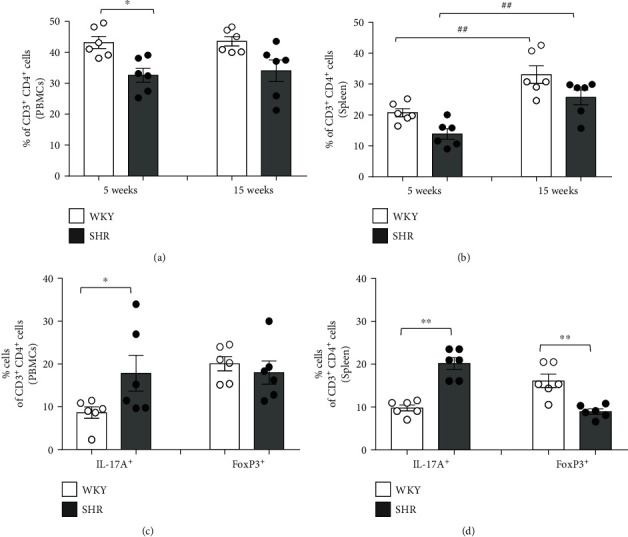
Figure 2.

T cell profiles of the peripheral blood mononuclear cells (PBMCs) and spleen in WKY and SHR. Quantification of flow cytometric analysis revealed the proportion of CD3+CD4+ (Th) cells of the (a) PBMCs and (b) spleen in juvenile and adult rats. The proportion of CD3+CD4+ (Th) cells of PBMCs was higher in WKY than in SHR. The proportion of CD3+CD4+ (Th) cells of the spleen revealed comparable in 5 weeks and 15 weeks, but increased at 15 weeks compared with 5 weeks (∗P < 0.05, ∗∗P < 0.01 vs. WKY; ##P < 0.01 vs. corresponding juvenile rats by two-way ANOVA followed by the post hoc Duncan test). Quantification of flow cytometric analysis revealed the proportion of CD4+IL-17A+ (Th17) and CD4+FoxP3+ (Treg) cells among CD3+CD4+ (Th) cells of the (c) PBMCs and (d) spleen in adult WKY and SHR by the gating strategy of flow cytometry. There was a higher proportion of CD4+IL-17A+ (Th17) cells of PBMCs in SHR than in WKY, and there was a lower proportion of CD4+FoxP3+ (Treg) cells in SHR than in WKY. Data are the mean ± SEM of 6 independent experiments (∗P < 0.05 vs. WKY by Student's t-test).
