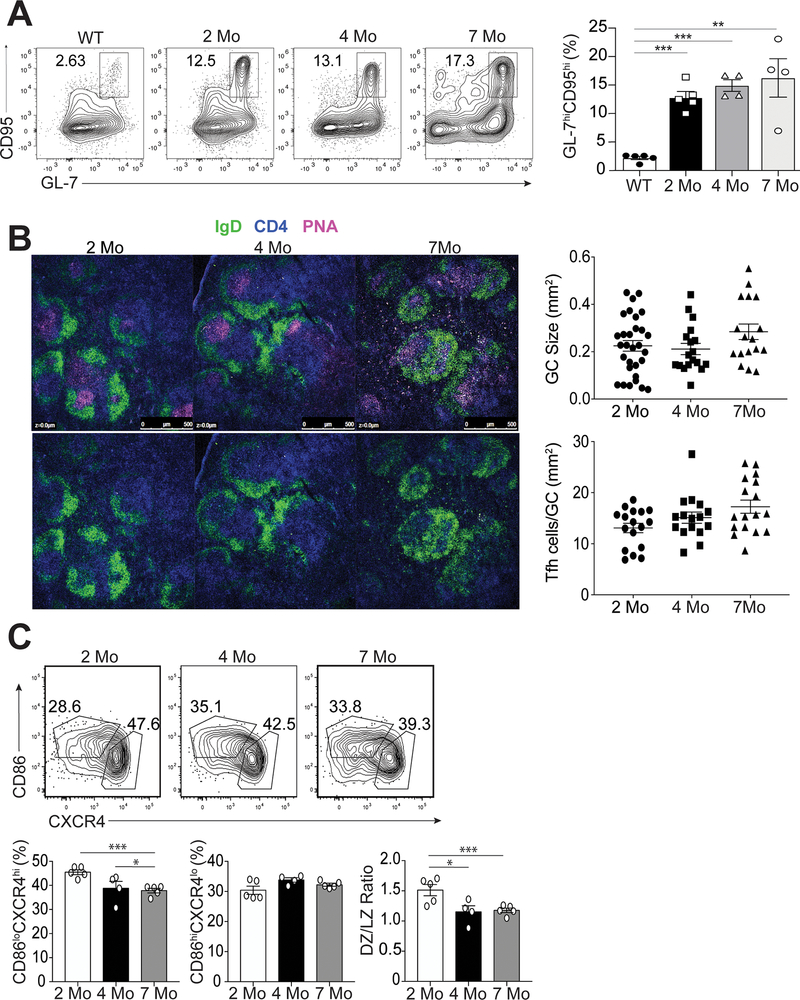
Figure 3.
Characterization of GC B cells during the progression of disease. Spleens were harvested from B6.Sle1.Yaa at 2, 4, and 7 months of age or control 2 months of age wild type B6 mice. (A) Representative flow cytometry plots of CD4-B220+IgDloCD95hiGL-7hi GC B cells at each time point with cell percentages (right). (B) Splenic B cell follicles of B6.Sle1.Yaa mice stained with anti-IgD (green), anti-CD4 (blue) and PNA (magenta), with GC sizes quantified (top right) and the numbers of T cells per GC size (bottom right). (C) Representative flow cytometry plots of dark zone (CD86-CXCR4+) and light zone (CD86+CXCR4-) GC B cells gated on CD4-B220+IgDloCD95hiGL-7hi GC B cells, with cell percentages and numbers (right). Data are representative of 3 experiments with 3–5 mice per group. ***p < 0.001; *p < 0.05 by Student’s t-test. Error bars represent SEM.

