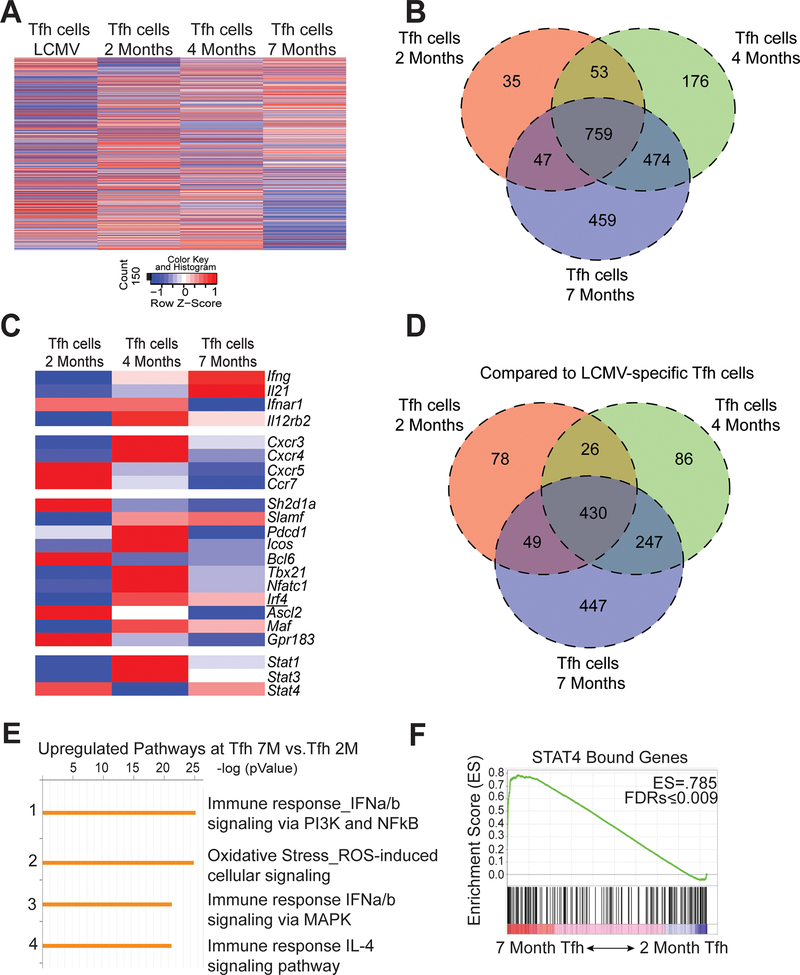
Figure 4.
Evolving transcriptional profile of Tfh cells during the progression of disease. Spleens were harvested from B6.Sle1.Yaa at 2, 4, and 7 months of age or from LCMV infected mice 8 days post infection. (A) Heat map of normalized hit counts for differentially expressed genes at 7 or 2 months (rows) in Tfh cells (columns). (B) Venn diagram of differentially expressed genes comparing Tfh cells from 2, 4, and 7 months of age mice to 2-month naïve control. (C) Heatmap of selected T cell-related genes. * FDR-adjusted q < 0.05 comparing Tfh cells at 7 months or 2 months. (D) Venn diagram comparing differentially expressed genes of Tfh cells from 2, 4, and 7 months of age mice to Tfh cells from Day 8 LCMV. (E) Enrichment pathways analysis of the upregulated genes in Tfh cells at 7 months to 2 months, with the top four pathways listed, including the enrichment p value. (F) GSEA revealed a significant enrichment in Stat4-dependent genes at 7-Mo vs. 2-Mo in Tfh cells. Number in top-right corner is the enrichment score. Data are representative of 2 replicates with 3 mice per group.

