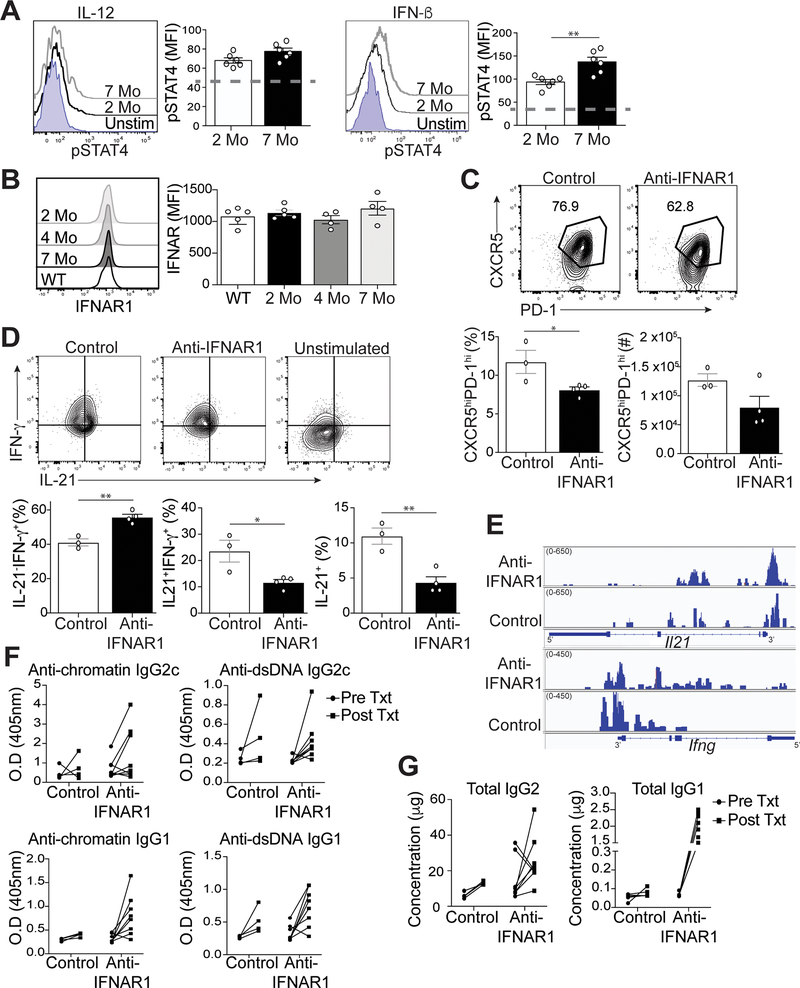
Figure 5.
IFN-I regulates Tfh cell-IL-21 and IFN-γ production in lupus. Spleens were harvested from B6.Sle1.Yaa mice at 2 and 7 months of age. (A) Splenocytes were stimulated with IL-12 or IFN-I. Representative flow histogram of pSTAT4 in Tfh cells was determined by intracellular staining (dashed line represents unstimulated control). (B) Representative flow cytometry plots of IFNAR1 on Tfh cells from B6.Sle1.Yaa mice with the MFI of IFNAR1 (right). (C) Splenocytes from 5-month B6.Sle1.Yaa mice treated twice a week for 4 weeks with either anti-IFNAR1 (375ug) or anti-rat IgG (1mg/mL). Representative flow cytometry plots of CXCR5hiPD-1hi Tfh cells from treated B6.Sle1.Yaa mice with percentages and numbers cells (bottom left and right, respectively). (D) Representative flow cytometry plots of intracellular IL-21 and IFN-γ staining in Tfh cells (top) with percentages of (bottom) of cytokine positive cells. Gates were based on unstimulated Tfh cells (top right). (E) Assay for transposase-accessible chromatin using sequencing (ATAC-seq) for Il21 and Ifng loci. (F) Anti-chromatin (left), anti-dsDNA antibodies (right), and (G) total Ig from sera of pre and post-treated mice. Data are representative of 2 experiments with 3–5 mice per group. **p < 0.01; *p < 0.05 by Student’s t-test. Error bars represent SEM.

