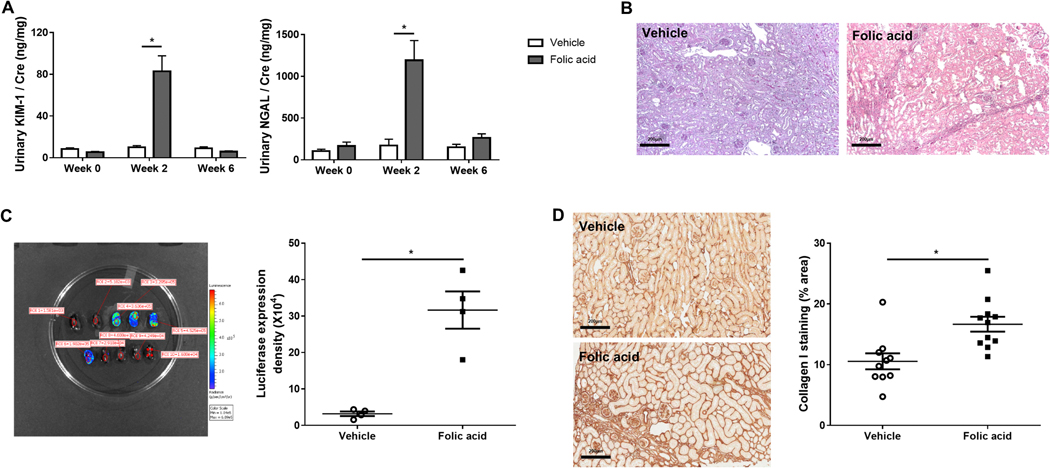
Figure 2. Folic acid-induced acute tubular injury in the acute phase and tubulointerstitial fibrosis in the chronic phase.
Urinary kidney injury molecules, KIM-1 and NGAL, excretion increased at week 2 and recovered at week 6 after folic acid injection (A). At week 6, folic acid-treated mice showed patchy tubulointerstitial fibrosis (PAS, ×100) (B). Quantitation assessed by region of interest (ROI) signal intensity of bioluminescence in each representative area of kidneys increased in folic acid versus vehicle (C). Representative images and quantitation of collagen I immunostaining positive area (percentage of the whole kidney cortex) showed increased collagen I production in the tubulointerstitium (×200) (D).

