Figure legend:
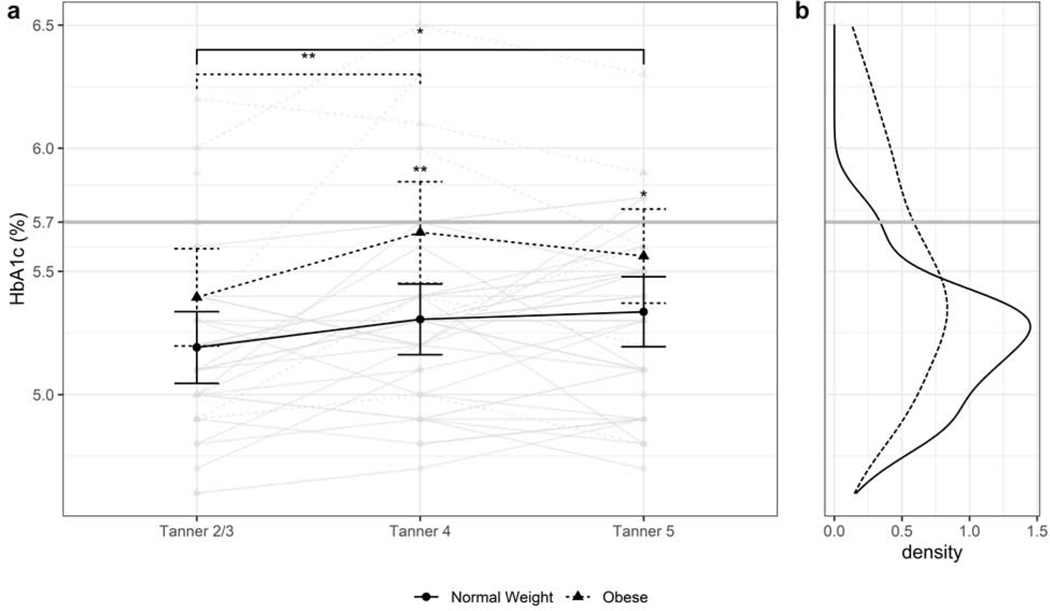
(a) Individual and mean changes in HbA1c in youth with normal weight or obesity. Mean HbA1c is significantly higher in youth with obesity at T4 and T5. In youth with normal weight, but not obesity, there is a significant rise in HbA1c from baseline to T4 and Tanner 5, suggesting an effect of puberty itself of normal glycemia. (b) Distribution of HbA1c in youth with normal weight and obesity. A proportion of youth in both groups experience an HbA1c above the American Diabetes Association-defined cut-point for prediabetes. *p<0.05, **p<0.01, ***p<0.001

