
Fig 3.
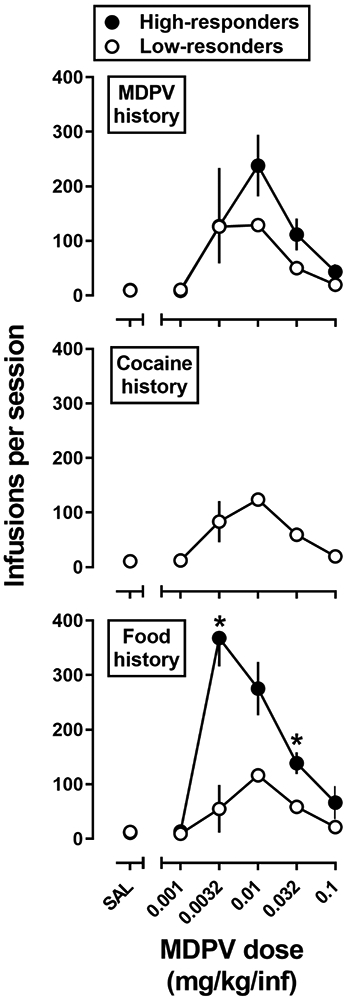
MDPV FR5 dose response curves in rats with a history of responding for MDPV (top; n=10), cocaine (middle; n=9), or food (bottom; n=10) in high- (filled symbols) and low-responder (open symbols) rats. Abscissa: SAL represents infusions of saline and the numbers refer to dose of MDPV available during each session, expressed as mg/kg/infusion on a log scale. Ordinate: total infusions obtained during the 90-minute session. Error bars represent ± 1 S.E.M.