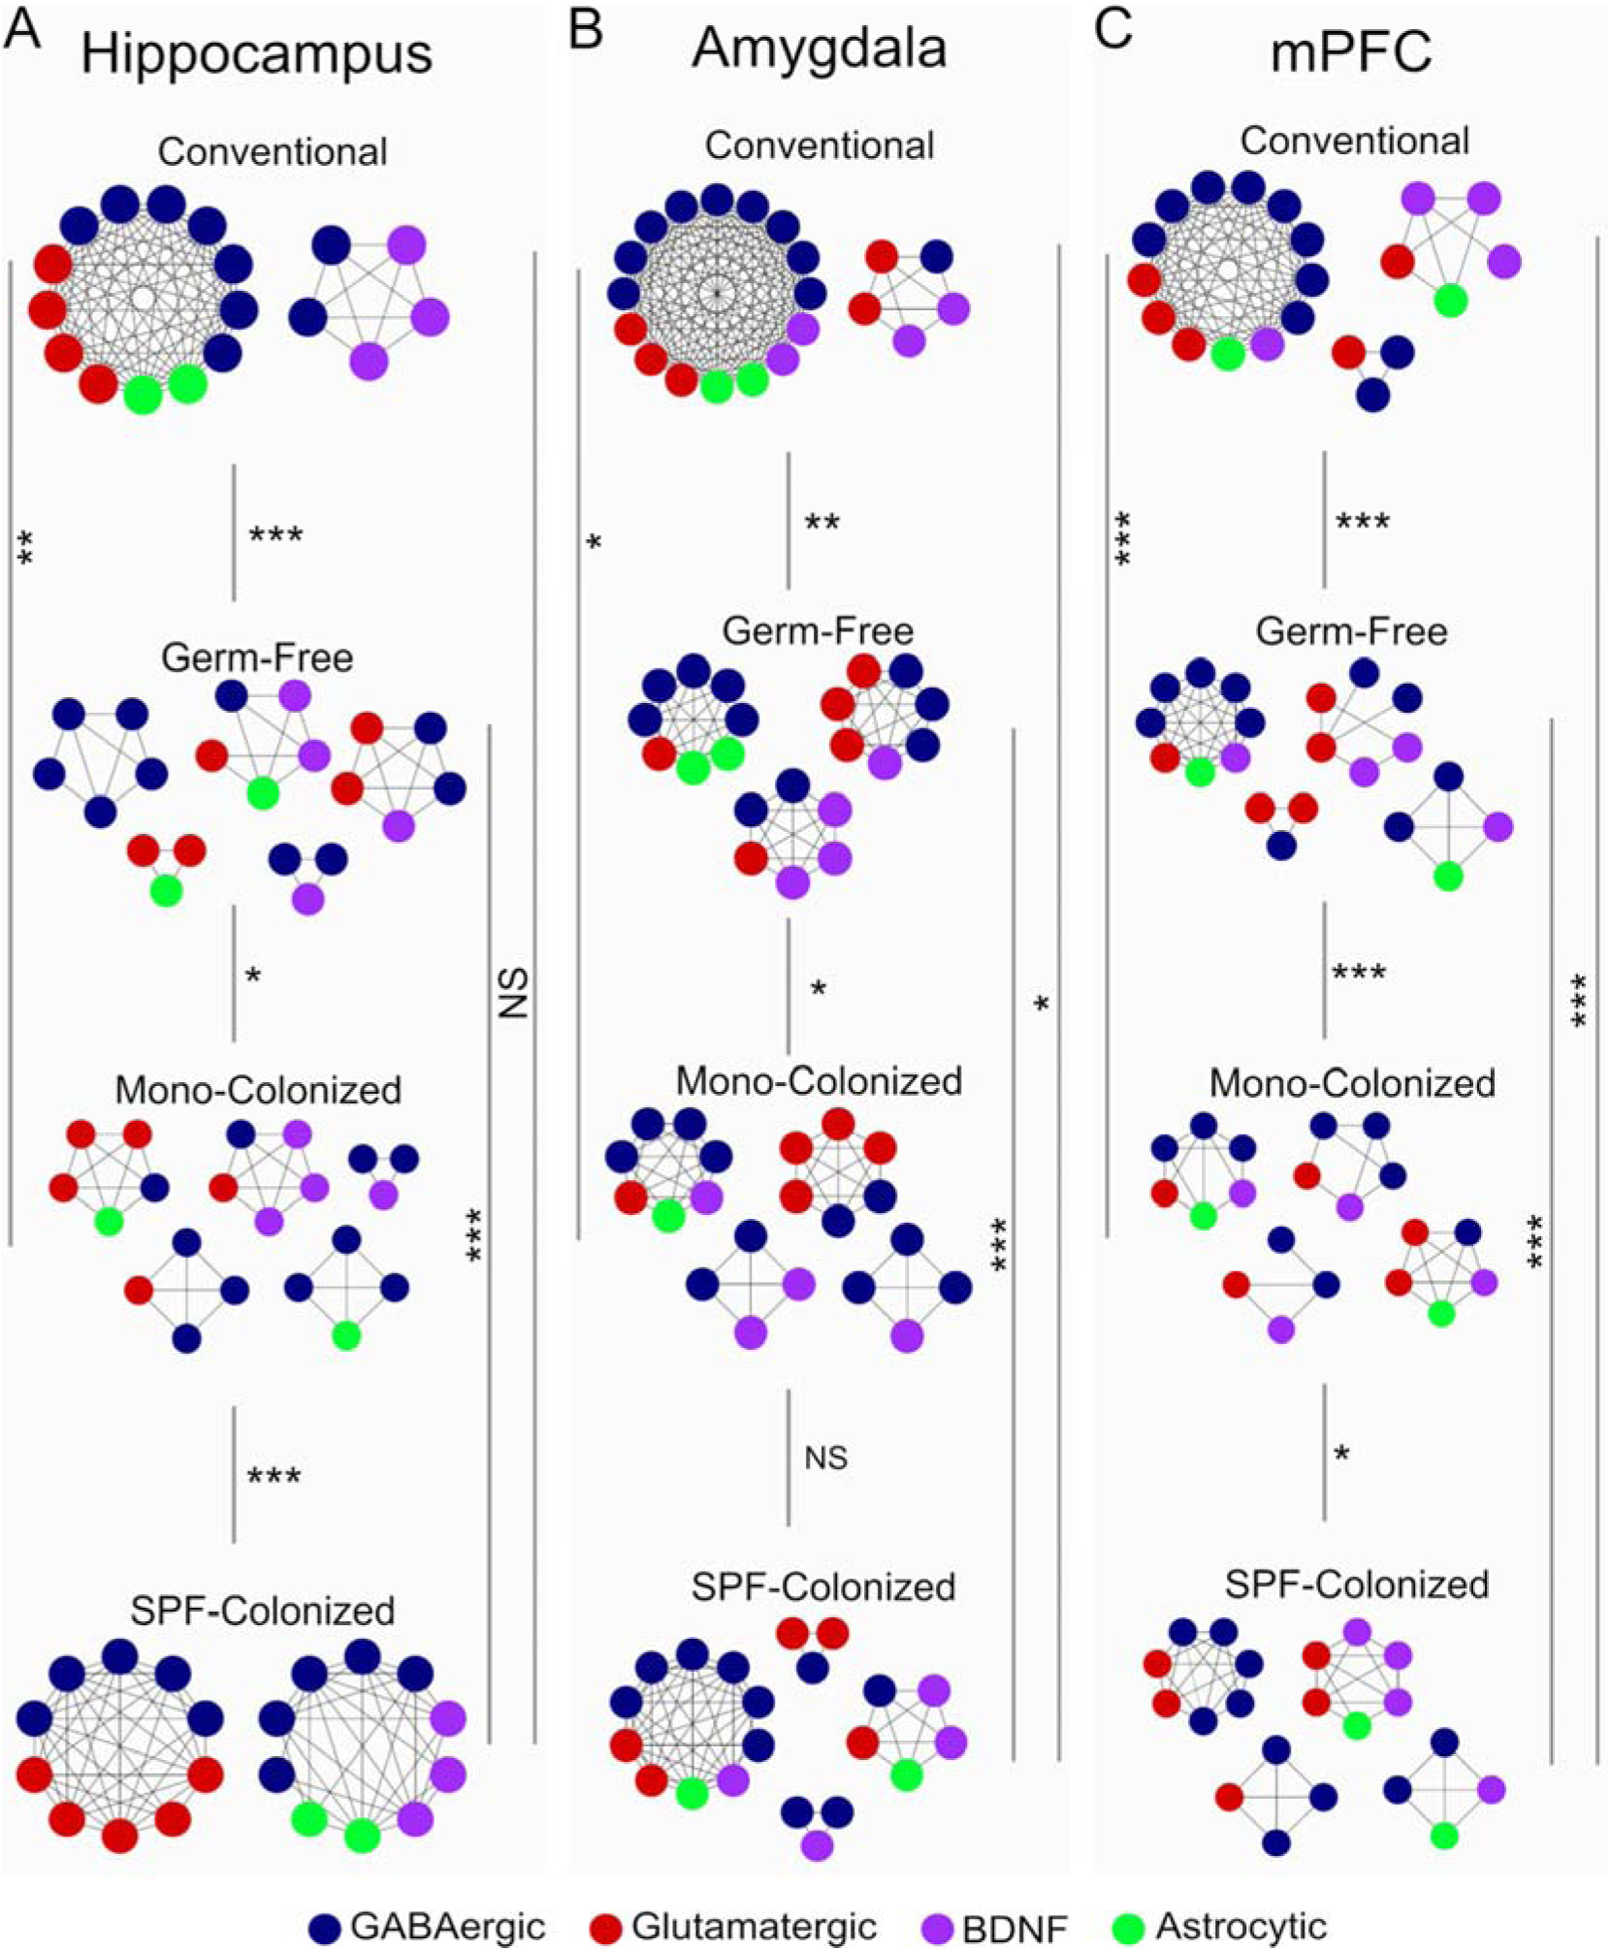
Figure 3. Region-specific effects of microbiota on gene co-expression networks.

Nodes represent genes (gene names removed for visual clarity, see supplementary figures 1–3 for complete annotations), and edges represent correlated gene expression between genes. Similarity of modules across experimental groups was performed by permutation test, and statistical significance was determined by p-value meta-analysis of all module-wise comparisons across groups. *p<0.05, **p<0.01, ***p<0.001.
