
Figure 4. Comparison of GF mouse and human MDD gene expression profiles in the hippocampus.
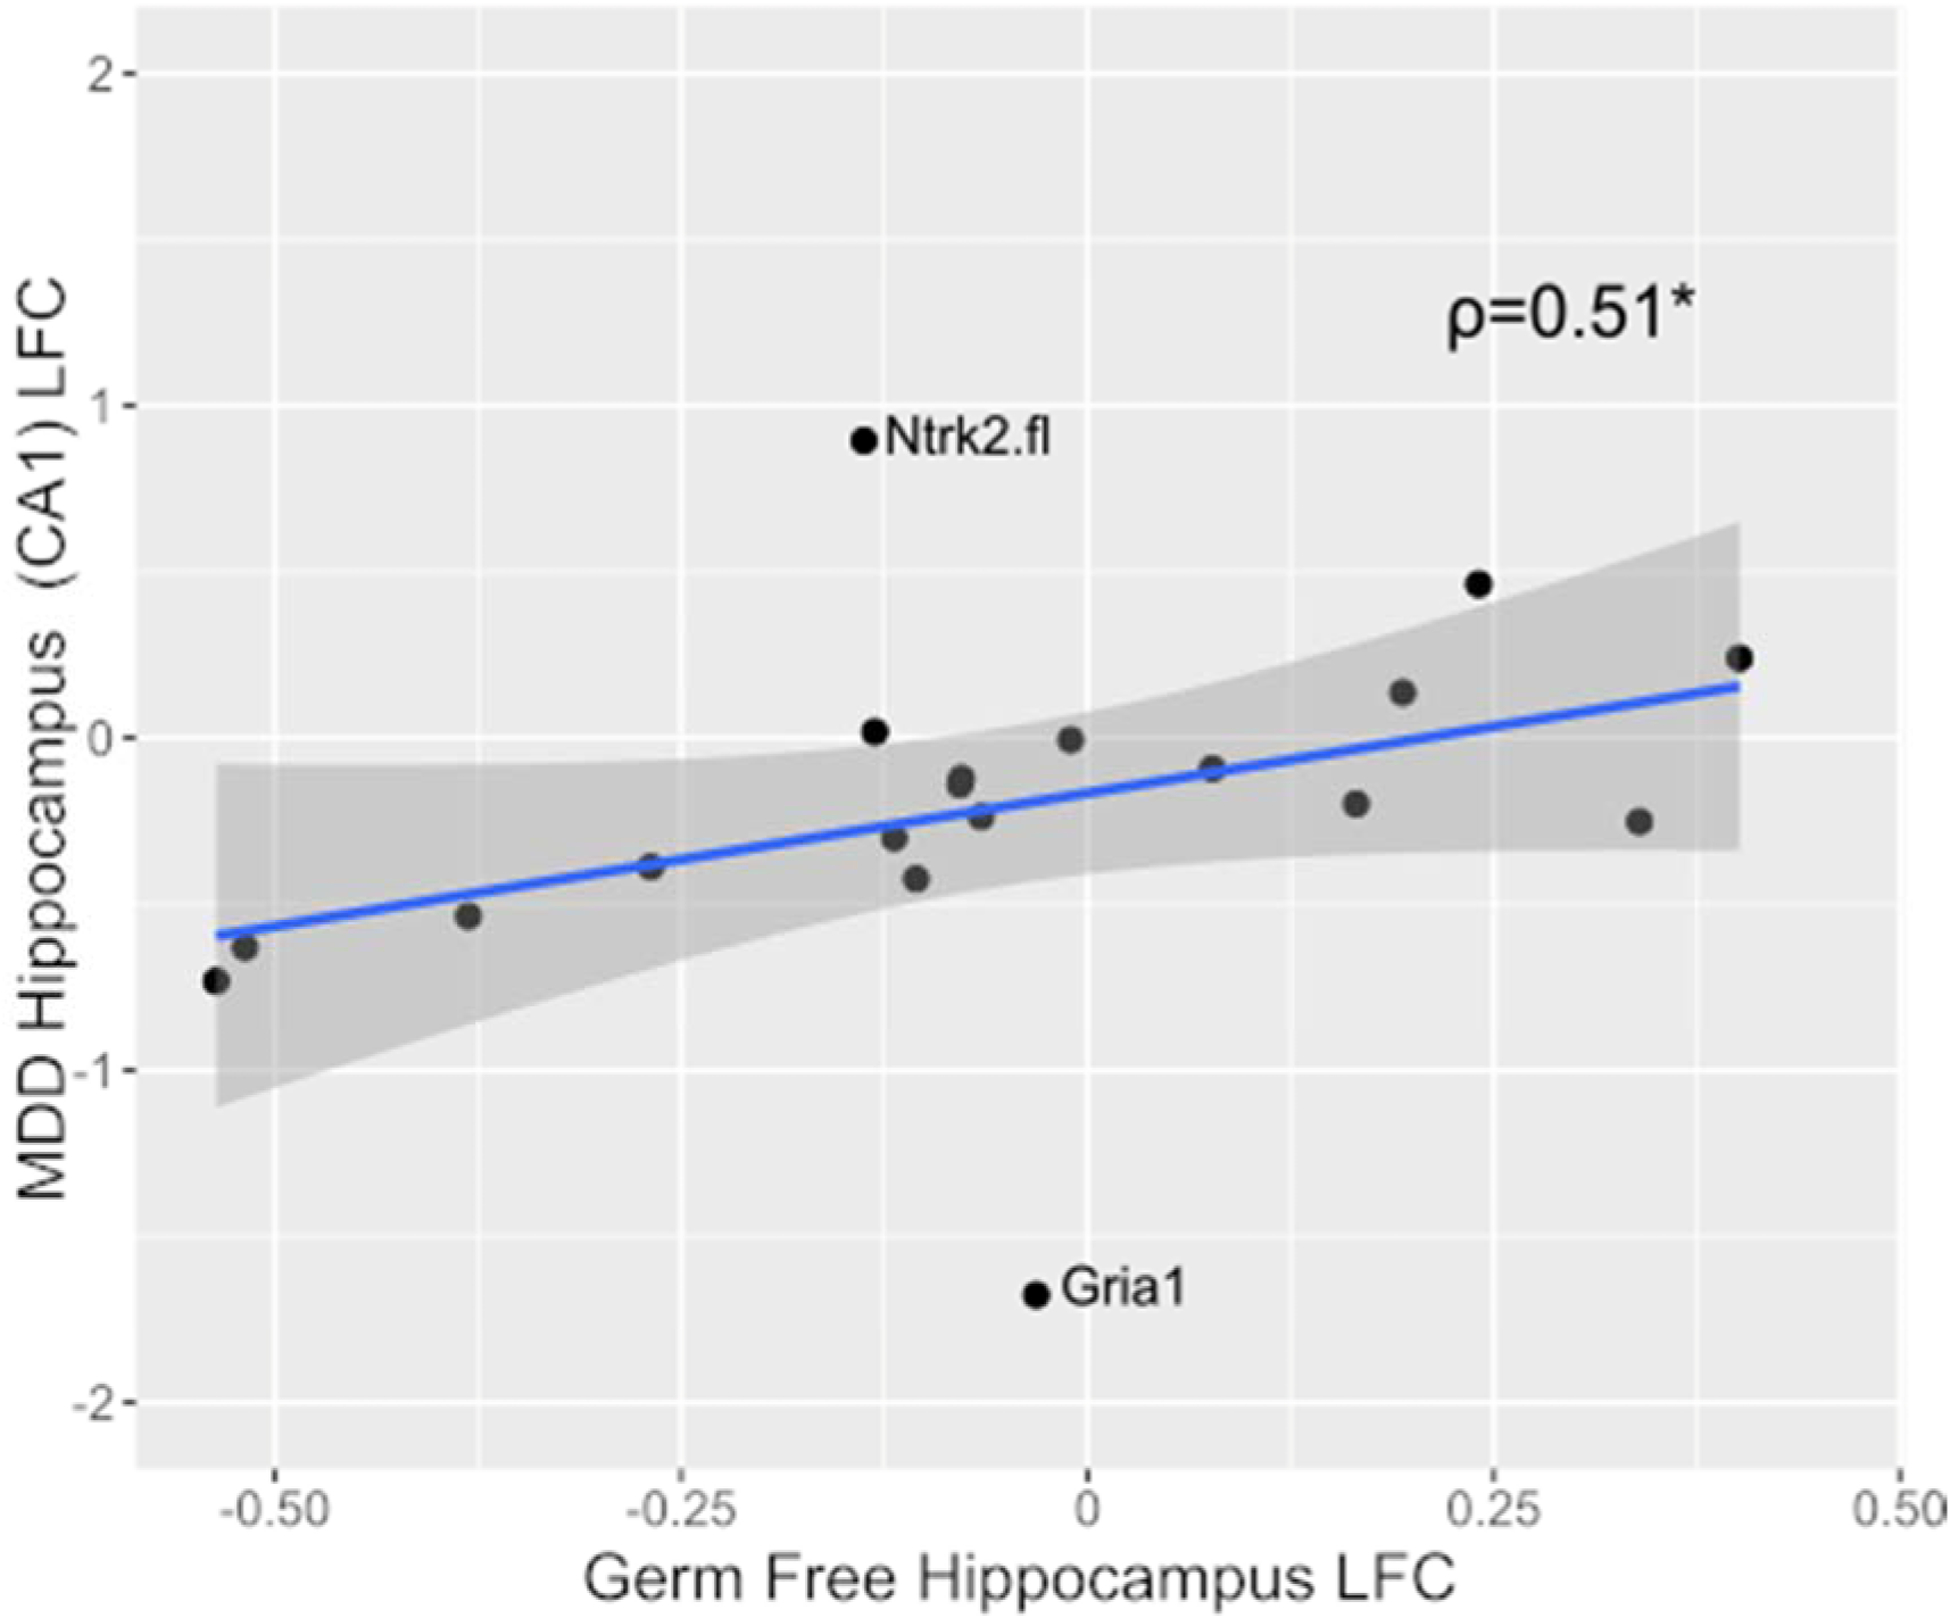
Log2 fold-change of the gene expression in GF-mice versus controls (conventional mice), compared to those observed in individuals with MDD versus controls. Spearman correlation revealed a significant positive association (ρ=0.51, p=0.027) between the two gene expression profiles. The shaded area shows the 95% confidence interval. This association remains significant after removal of Ntrk2.fl and Gria1 (ρ=0.742, p=9.48×10⁻⁴). *p<0.05.