Figure 2.
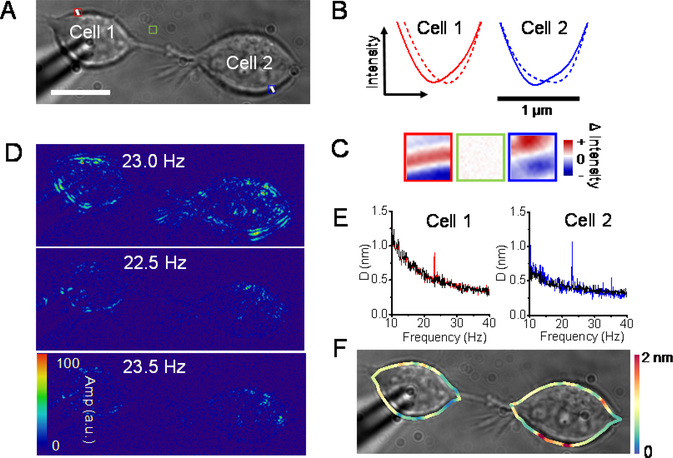
Electrical modulation can induce mechanical motion in both connected cells. (A) Bright field image of two connected cells. (B) The intensity of crossline on the cell edge is profiled at −60 mV (solid line) and 90 mV (dash line). The rightward arrow indicates the inside of the cells. (C) Difference images of the ROI in panel (A). (D) Difference images at 23 Hz and nearby frequencies. (E) The mean edge displacements of the cell 1 (red) and cell 2 (blue). The black curves indicate the background of the membrane motion in the absence of stimulation. (F) Edge displacement map obtained from the differential algorithm. Scale bars, 15 μm.

