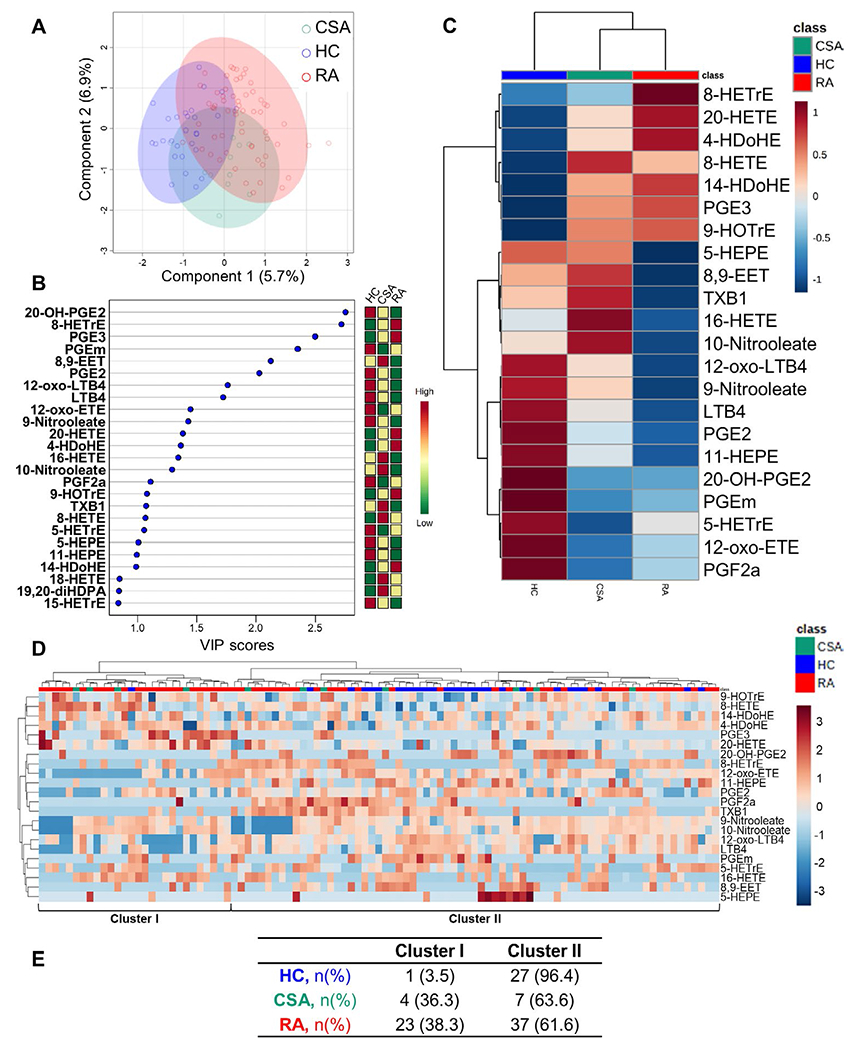
Figure 2.

Oxylipin profiling across study groups. A, Partial least-squares discriminant analysis (PLS-DA) was used to assess the discriminant capacity of all identified oxylipins, based on the amount of variance explained by the first 2 components. B, The top 25 oxylipins were ranked based on variable important projection (VIP) scores from the PLS-DA model (left). The heatmap indicates the concentration ranks across the different groups (right). C, A group-averaged heatmap was constructed based on the 22 oxylipins with a VIP score >1. D, A heatmap based on the 22 oxylipins with a VIP score >1 was used to identify 2 oxylipin clusters according to levels (ranging from high [shades of red] to low [shades of blue]). In C and D, the upper key indicates group classes. E, The number (%) of individuals in each oxylipin cluster is shown by study group. See Figure 1 for other definitions.
