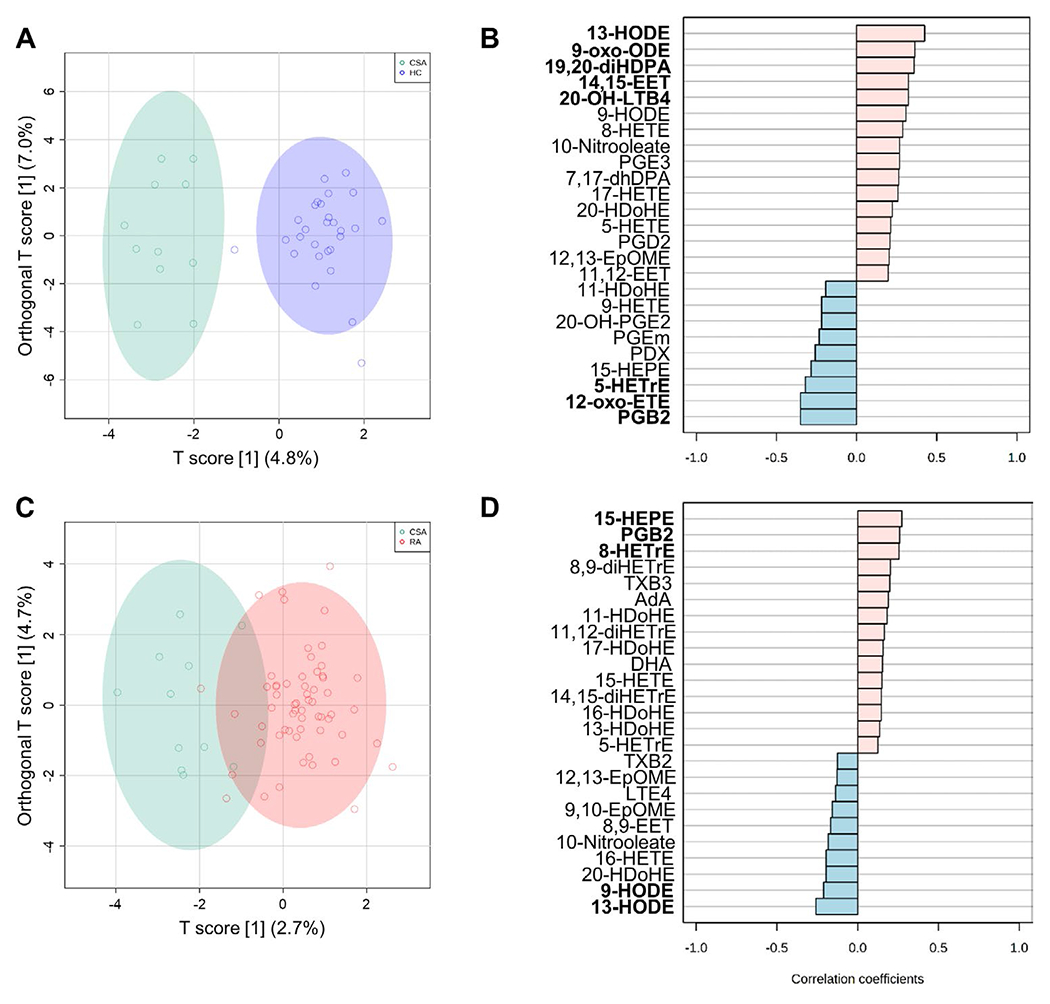
Figure 3.

Oxylipin signatures associated with the earliest stages of RA. A and C, Orthagonal partial least-squares discriminant analysis models were constructed to evaluate the discriminant capacity of all oxylipins identified, showing comparisons between the healthy control and CSA groups (A) or the CSA and RA groups (C). B and D, Correlation patterns were determined for the top 25 oxylipins exhibiting the transition patterns healthy controlÂCSA (B) or CSAÂRA (D), based on Spearman’s rank correlation test as a distance measure. Oxylipins with statistically significant correlations are highlighted in boldface type. See Figure 1 for definitions.
