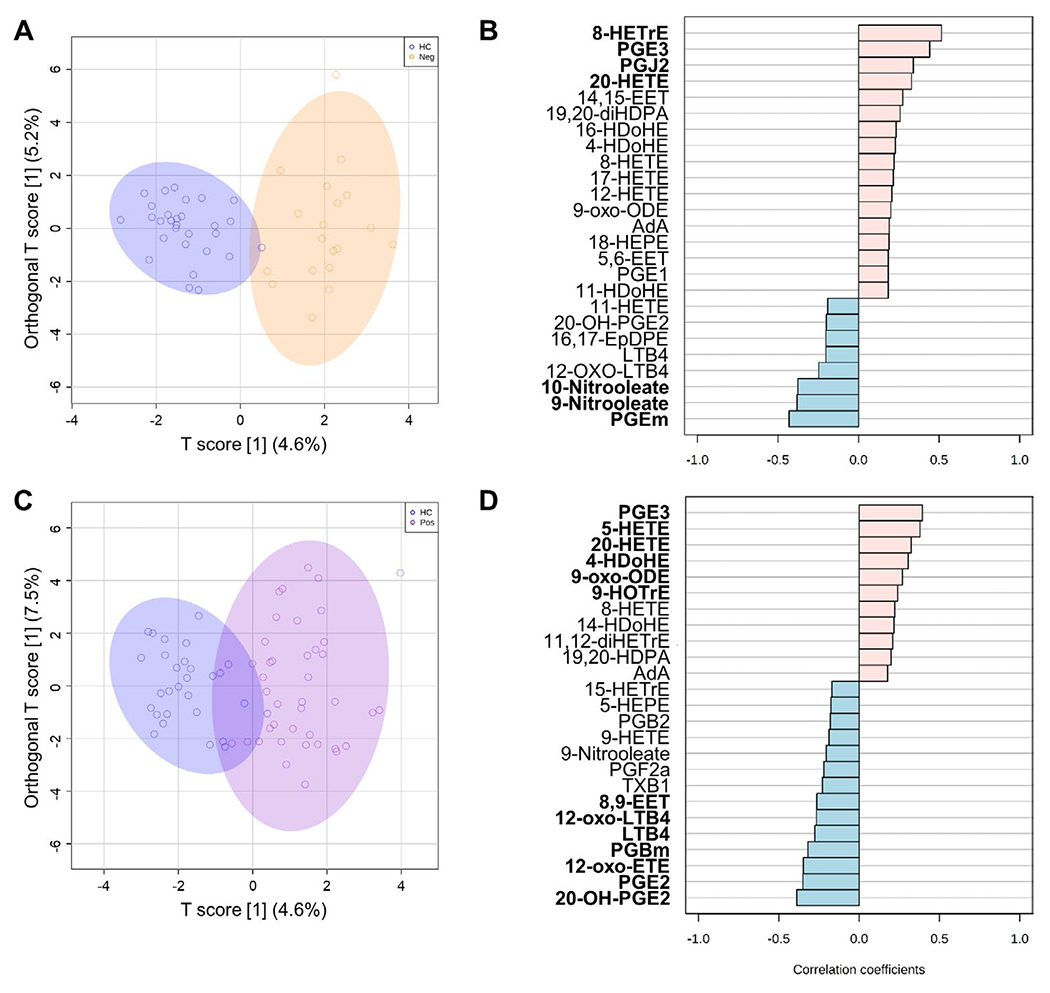
Figure 4.

Oxylipin signatures associated with seropositivity in early RA. A and C, Orthagonal partial least-squares discriminant analysis models were constructed to evaluate the discriminant capacity of all oxylipins identified, showing comparisons between the healthy control and seronegative RA (rheumatoid factor-negative/anti-citrullinated protein antibody-negative) groups (A) or the healthy control and seropositive RA groups (C. B and D, Correlation patterns were determined for the top 25 oxylipins exhibiting the transition patterns healthy control→eronegative RA (B) or healthy control→seropositive RA (D), based on Spearman’s rank correlation test as a distance measure. Oxylipins with statistically significant correlations are highlighted in boldface type. See Figure 1 for definitions.
