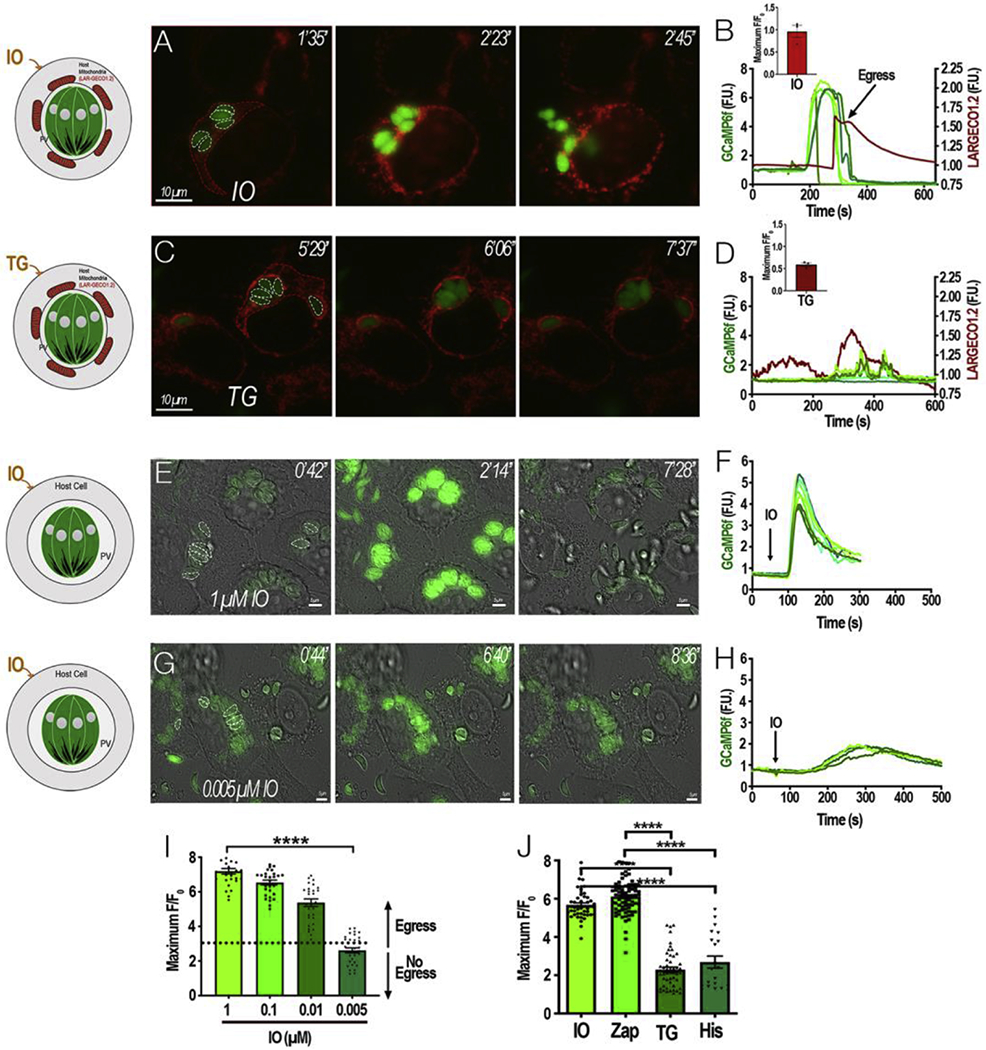
Figure 2: A threshold for the tachyzoite cytosolic Ca2+:

HeLa cells expressing the mitochondrial Ca2+ indicator LAR-GECO1.2 were infected with tachyzoites expressing cytosolic GCaMP6f for approximately 20 h. The host mitochondria surrounding each PV becomes labeled with LAR-GECO1.2 (red). Dashed white outlines show GCaMP6f-expressing parasites whose fluorescence were used for the analysis in B. Dashed red outlines indicate the region of the host cell that was used to analyze the LAR-GECO1.2 fluorescence in B. Numbers at the upper right of each panel indicate the time frame of the video. A, Addition of 1 μM ionomycin (IO) stimulated egress. B, Fluorescence tracings of single parasites shown in A (green) or the host cell area (red) after addition of IO. The left Y axis scale shows green fluorescence and the right Y axis scale shows red fluorescence changes. Inset bar graph represents ΔFluorescence values of IO response with S.E.M represented by error bars. C, Addition of 2 μM thapsigargin (TG) at 1 min leads to stimulation of red fluorescence (host cytosol) trailed by green fluorescence (parasite cytosol). D, Fluorescence tracings of areas indicated in B (green) or the host cell area (red) after addition of TG. Inset bar graph represents ΔFluorescence values of TG response with S.E.M represented by error bars. E and G, HeLa cells infected with GCaMP6f parasites and IO was added at the indicated concentration (1 and 0.005 μM, respectively). Dashed white outlines indicate the area used as a region of interest to analyze the fluorescence changes shown in F and H. Numbers at the upper right of each panel indicate the time frame of the video. F and H, fluorescence tracings of parasites shown in E and G respectively. I, Average ΔF of GCaMP6 fluorescence after stimulating cultures with 1, 0.1, 0.01, and 0.005 μM IO. The ΔF values of GCaMP6f expressing parasites were determined after the addition of IO. Data from 3 independent sets of experiments were combined and the average was calculated. Error bars represent the S.E.M. **** represent a p-value ≤ 0.0001 in a T-test between 1 μM and 0.005 μM IO average ΔF values. J, Comparison of ΔF values generated by different agonists.
