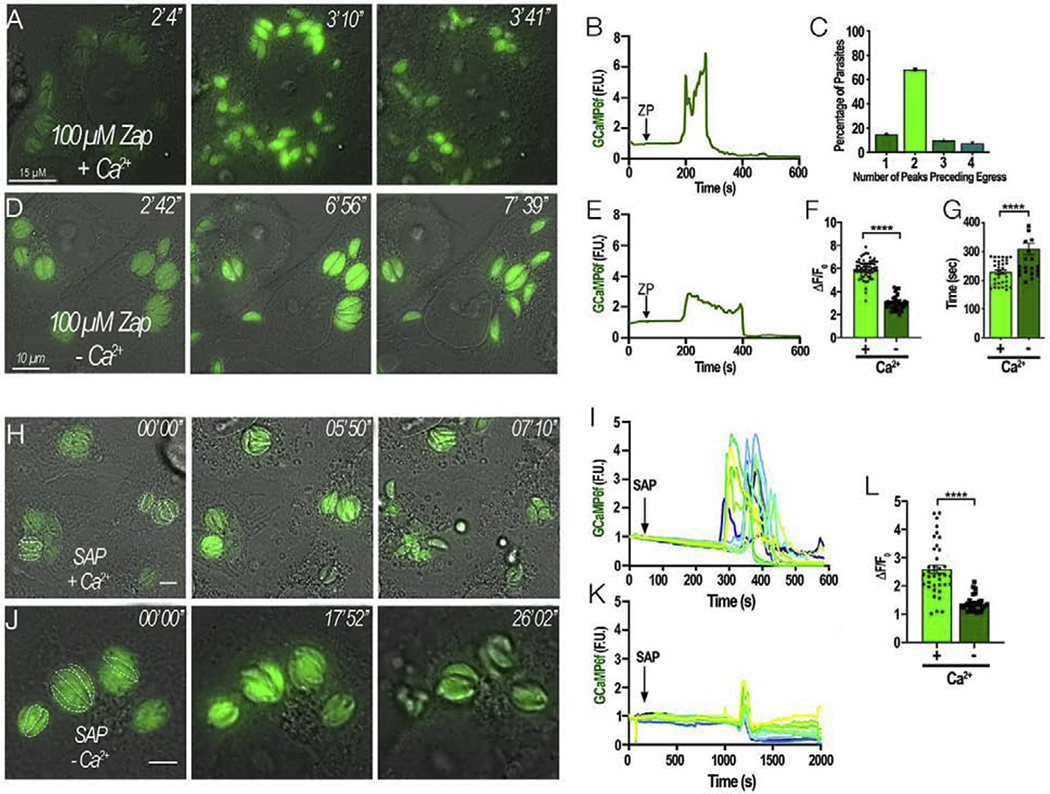
Figure 3: Two peaks of Ca2+ precede egress:

A and D, HeLa cells infected with tachyzoites expressing cytosolic GCaMP6f were stimulated to egress with 100 μM Zaprinast. They were bathed in Ringer buffer supplemented with either 2 mM Ca2+ (+ Ca2+, A) or 100 μM EGTA (− Ca2+, D). The numbers at the upper right of each panel indicate the time frame of the video. B and E, Representative fluorescence tracings of single parasites under Zaprinast simulation in the presence of high or low Ca2+, respectively. Note that under low Ca2+ conditions (100 μM EGTA) the second peak is reduced. C, Quantification of GCaMP6f peak numbers preceding egress. Graph represents the combined summation of 3 independent experiments. F, Amplitude of the second Ca2+ peak after stimulating egress with Zaprinast in the presence of high (+) and low Ca2+ (−). G, Average time of egress comparing Zaprinast induced egress from cells resuspended in extracellular media supplemented with either 2 mM Ca2+ (+) or 100 μM EGTA (−). Error bars represent the S.E.M. in which **** represents a p-value ≤ 0.0001. H, Intracellular GCaMP6f parasites were treated with 0.01% (w/v) saponin to permeabilize the host cells in Ringer buffer with 2 mM Ca2+ (SAP + Ca2+). Dashed white outlines represent the parasites that were used for the analysis. Numbers at the upper right of each panel indicate the time frame of the video. I, Representative fluorescence tracings of egressing parasites treated with saponin in +Ca2+ conditions taken from H. J, Intracellular GCaMP6f parasites were exposed to Saponin 0.01% (w/v) in Ringer buffer with 1 mM EGTA (SAP – Ca2+). Dashed white outlines represent the parasites that were used in the analysis. Numbers at the upper right of each panel indicate the time frame of the video. K, Representative fluorescence tracings of non-egressing parasites treated with saponin in Ca2+-free conditions as shown in J. L, amplitude of the ΔF changes from fluorescent parasites in H and J.
