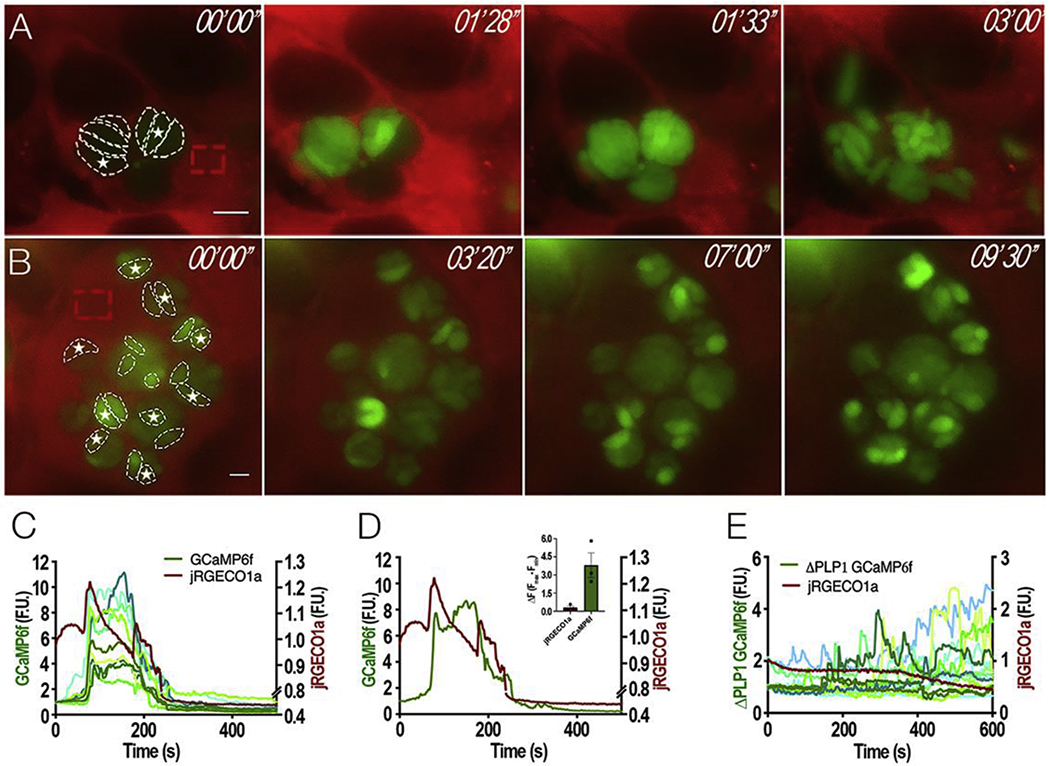
Figure 4: Cytosolic Ca2+ during natural egress:

Intracellular parasites expressing cytosolic GCaMP6f were synchronized for natural egress with Compound 1 (cpd1). A, still images of HeLa cells expressing jRGECO1a infected with tachyzoites expressing GCaMP6f and treated with 1 μM cpd1 for 24 hours. After washing off cpd1, parasites egressed within 3-5 min. Dashed white outlines show fluorescent parasites used for the analyses in C and D. Dashed red outlines indicate the region of the host cell used to analyze the jRGECO1a fluorescence. Numbers at the upper right of each panel indicate the time frame of the video. White stars indicate “leader” parasites whose fluorescence begins the egress process. B, still images of HeLa cells expressing jRGECO1a infected with ΔPLP1 tachyzoites expressing cytosolic GCaMP6f and treated with 1 μM cpd1 for 24 hours. Washing off cpd1, results in egress within 3–5 mins. Dashed regions show the ΔPLP1 fluorescent parasites used for the analysis shown in E. Dashed red outlines indicate the region of the host cell that was used to analyze the jRGECO1a fluorescence. Numbers at the upper right of each panel indicate the time frame of the video. White stars indicate “leader” parasites, which shows the highest increase in cytosolic Ca2+. C, Fluorescence tracings of host cell jREGO1a (red tracing, scale shown on the right Y axis) and GCaMP6f parasites (green tracings, left Y axis); D, Fluorescence tracings of host cell jREGO1a (red tracing) and a single parasite expressing GCaMP6f (green tracing). Note that parasites that egress show two fluorescence peaks; Inset, Quantification of 3 independent trials of ΔF of jRGECO1a (red bar) and GCaMP6f (green bar) after cpd1 washout. Error bars represent the S.E.M. E, Fluorescence tracings of host cell jREGO1a (red tracing, right Y axis) and ΔPLP1 GCaMP6f parasites (green tracings, Y left axis). Size bars are 5 μm.
