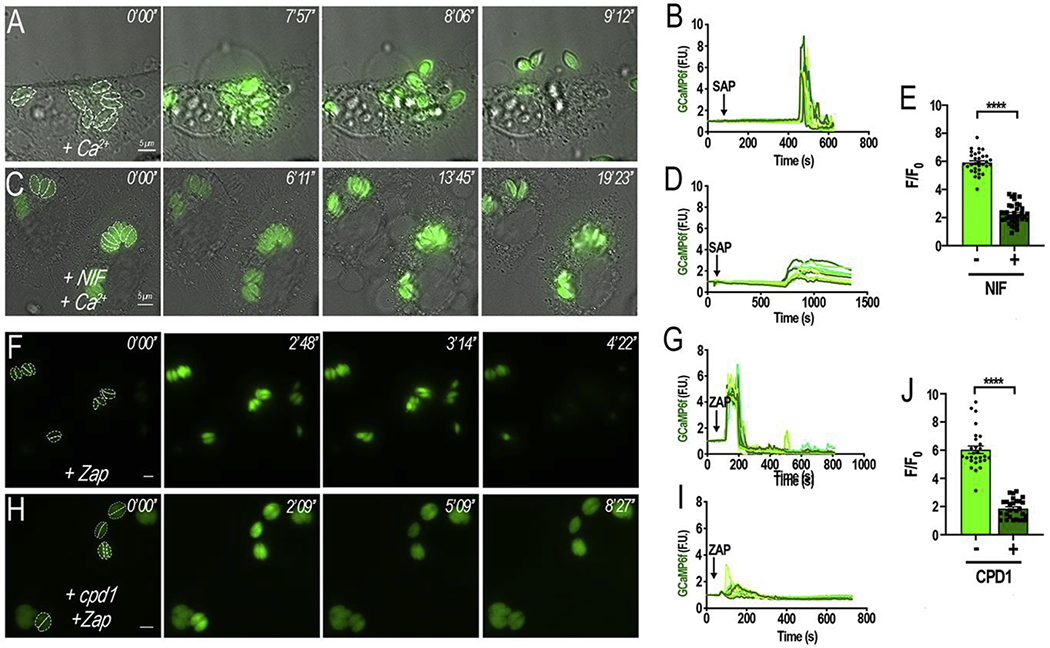
Figure 5: Pharmacological inhibition of Ca2+ influx leads to inhibition of egress:

A, HeLa cells infected with tachyzoites expressing cytosolic GCaMP6f were exposed to 2 mM Ca2+ (+ Ca2+) containing 0.01% (w/v) saponin. B, Fluorescence tracings of egressing parasites (dashed outlines in A) after the addition of saponin in media with 2 mM Ca2+; C, HeLa cells infected with tachyzoites expressing GCaMP6f were pretreated for 5 min with 10 μM nifedipine (NIF) in the presence of 2 mM Ca2+ (+NIF +Ca2+) containing 0.01% (w/v) saponin. Note that parasites did not egress under these conditions; D, Tracings obtained following the fluorescence signal from the parasites highlighted in C. E, quantification and statistical analysis of the ΔF + and − NIF calculated from three independent experiments (p< 0.001). F, HeLa cells infected with tachyzoites expressing cytosolic GCaMP6f were stimulated with 100 μM Zaprinast; G, Tracings obtained following the fluorescence signal from the parasites highlighted in F. G, HeLa cells infected with tachyzoites expressing cytosolic GCaMP6f were pretreated with 1 μM of cpd1 for 5 mins prior to stimulation with 100 μM Zaprinast. Cytosolic Ca2+ slightly and briefly oscillated but no egress was evident; I, Tracings obtained following the fluorescence signal from the parasites highlighted in H. Dashed outlines indicate the area used as a region of interest for the analysis of the fluorescence changes shown in the tracings. Numbers at the upper right of each panel indicate the time frame of the video. J, quantification and statistical analysis of the ΔF with and without cpd1 calculated from three independent experiments (p< 0.001). Size bars are 5 μm.
