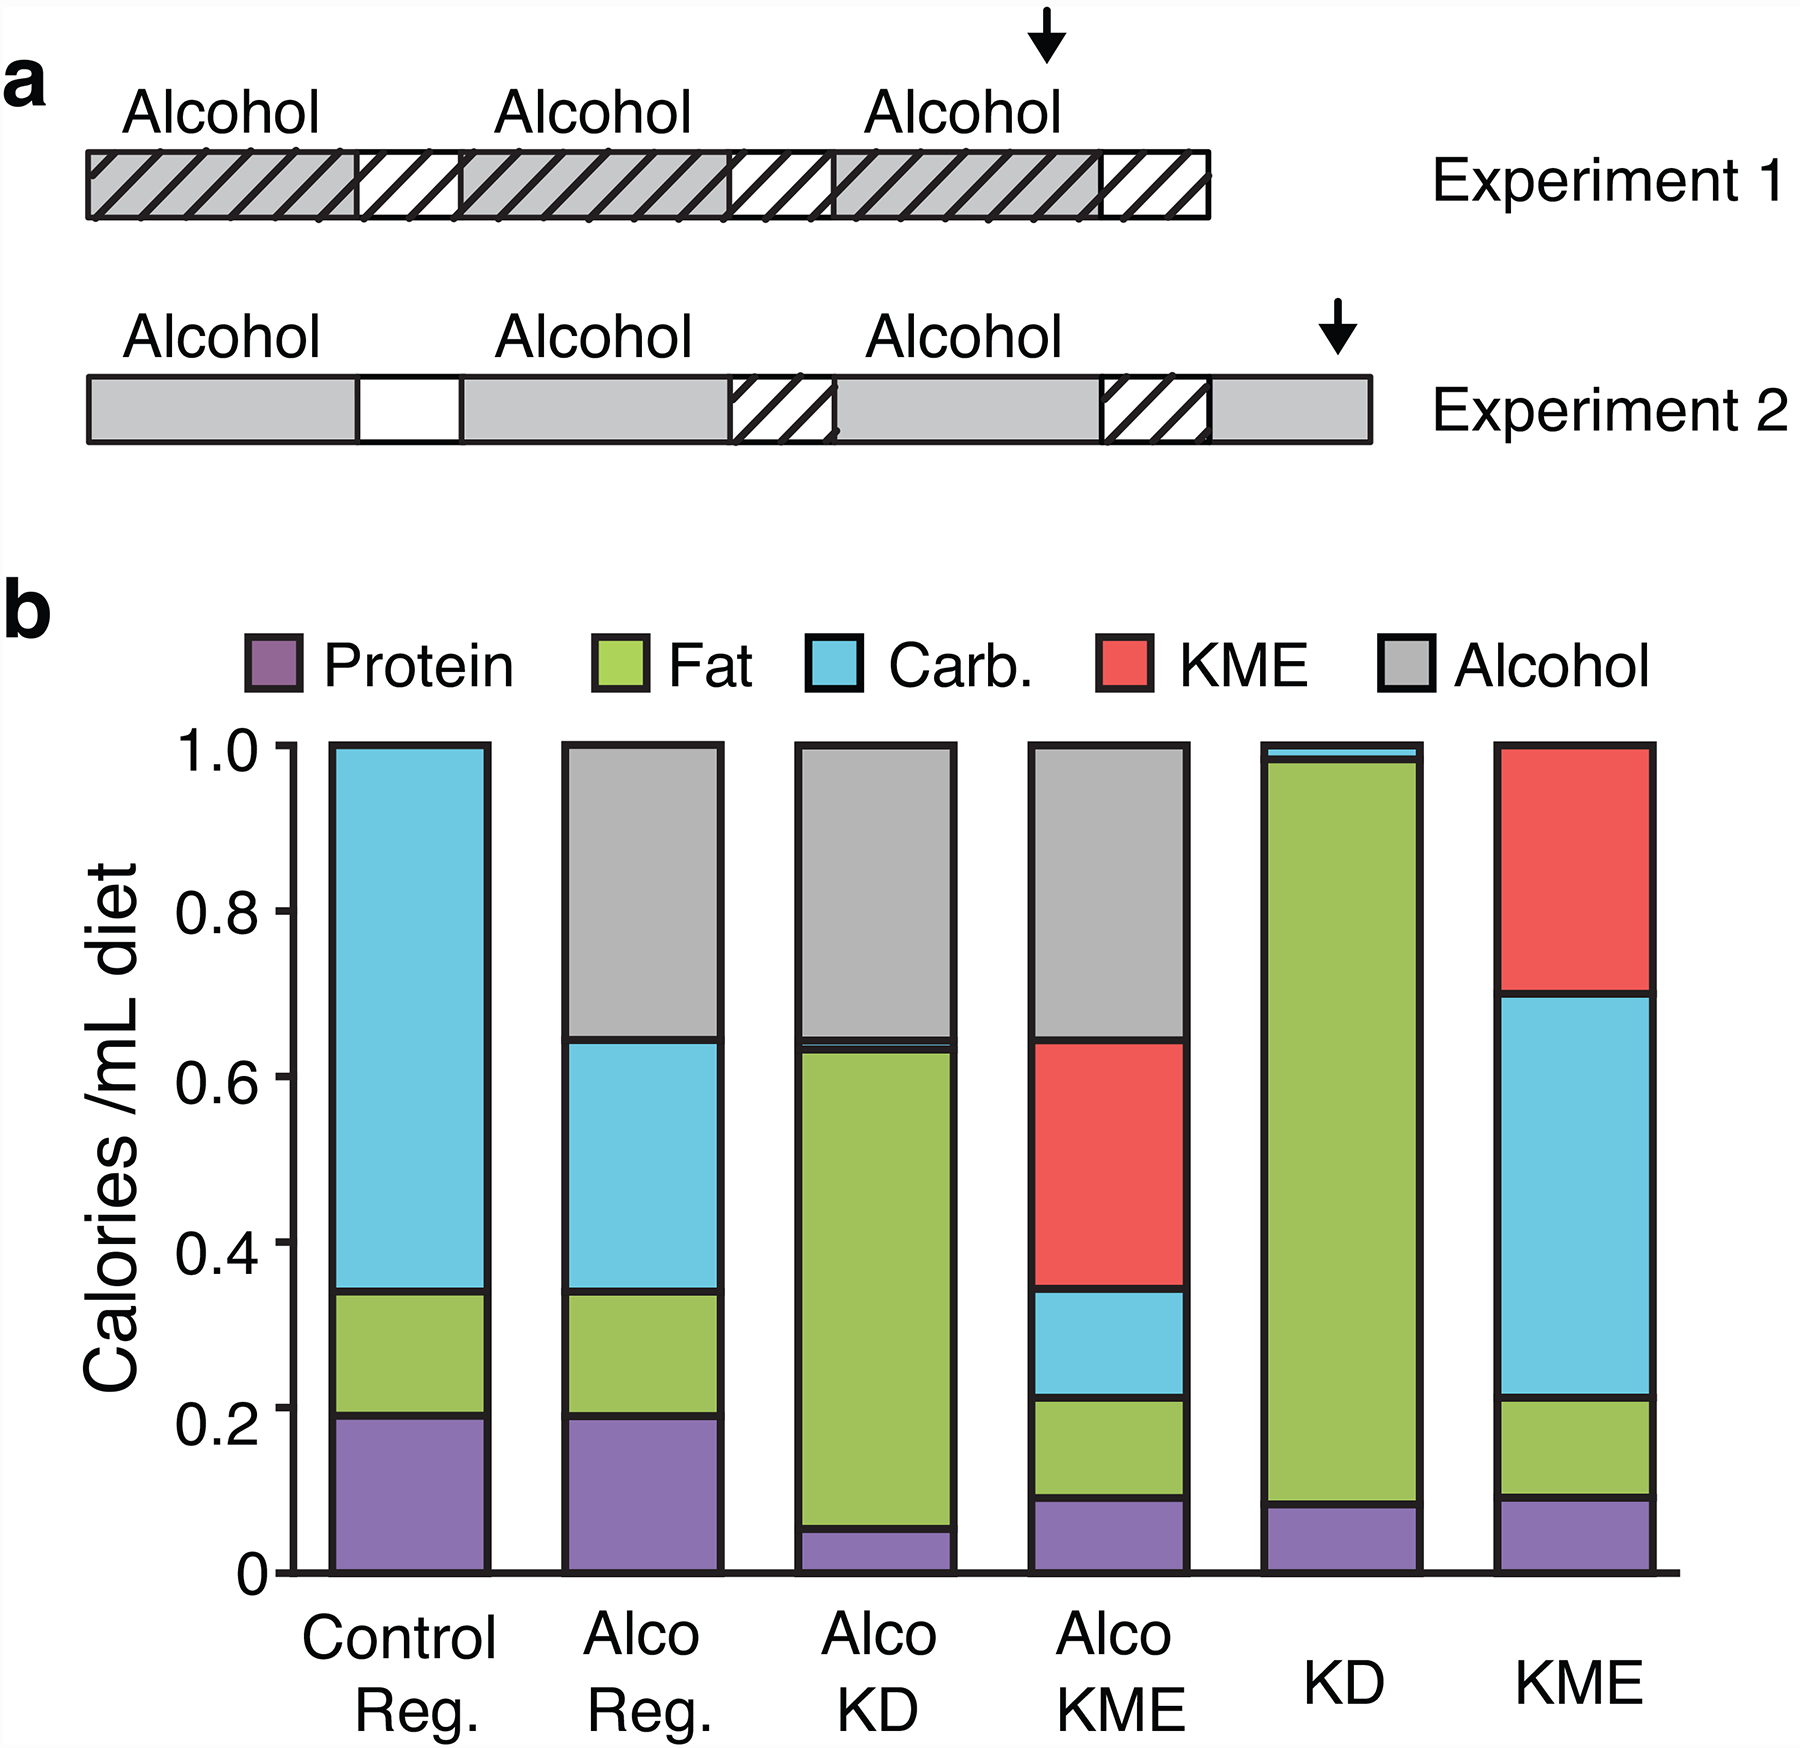
Fig. 1. Experimental setup and diets.

(a) Timeline of alcohol exposure (grey) and forced abstinence (open), with test times as hours since alcohol removal shown for the last cycle. Periods with test diets are indicated by diagonal hatching. Arrows indicate blood alcohol sampling (pointing down) or light-dark transition test (pointing up). (b) Composition of diets as calories provided by each nutrient, per mL diet. Reg.: regular diet. Alco: alcohol-containing. All diets also contained vitamins, minerals, and 5.5–5.7% fiber.
