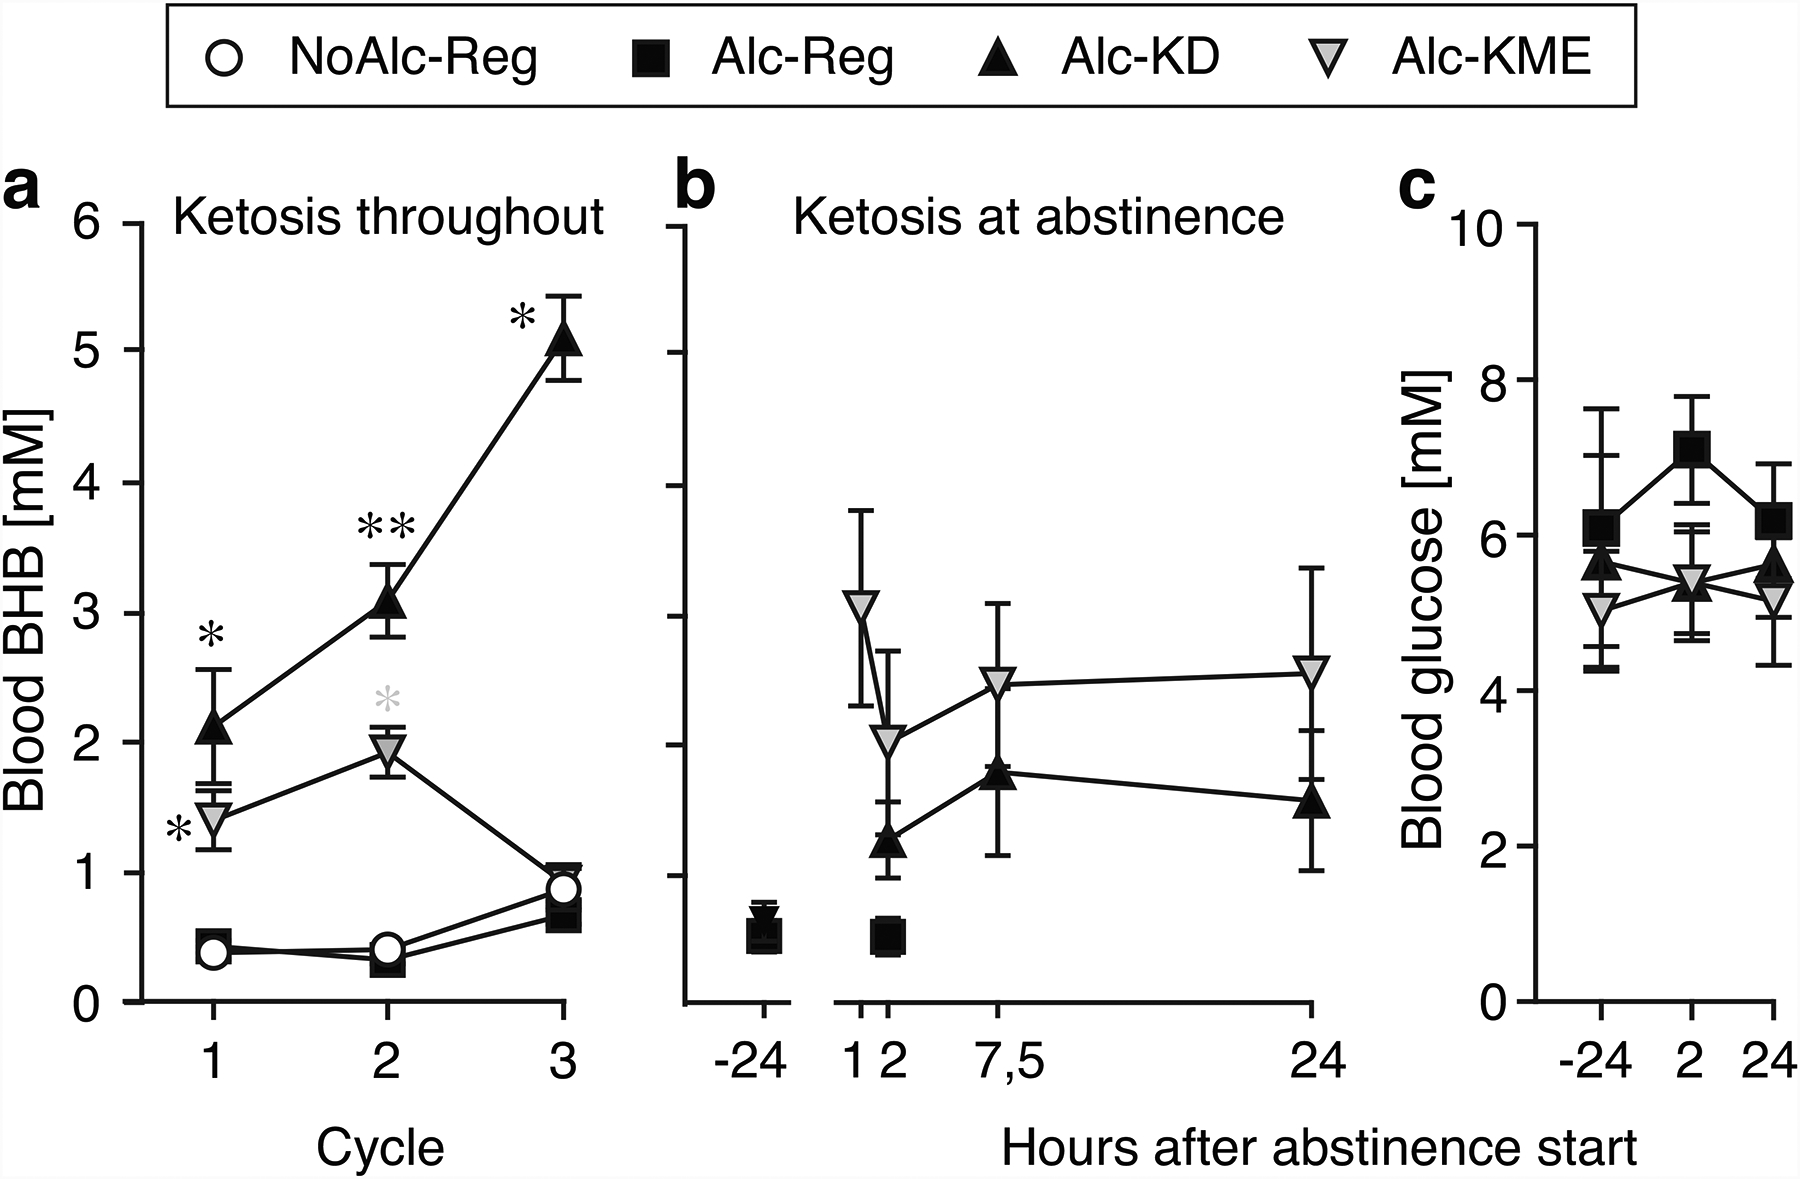
Fig. 2. Blood ketone and glucose levels.

Blood BHB as a function of time in the “Keto Throughout” experiment (a, n=12) and the “Keto After” experiment (b, n=10–12), blood glucose as a function of time in “Keto After” (c, n=10–12). *p<0.05, **p<0.01 vs. alcohol-regular diet. Data are group means ± s.e.m.
