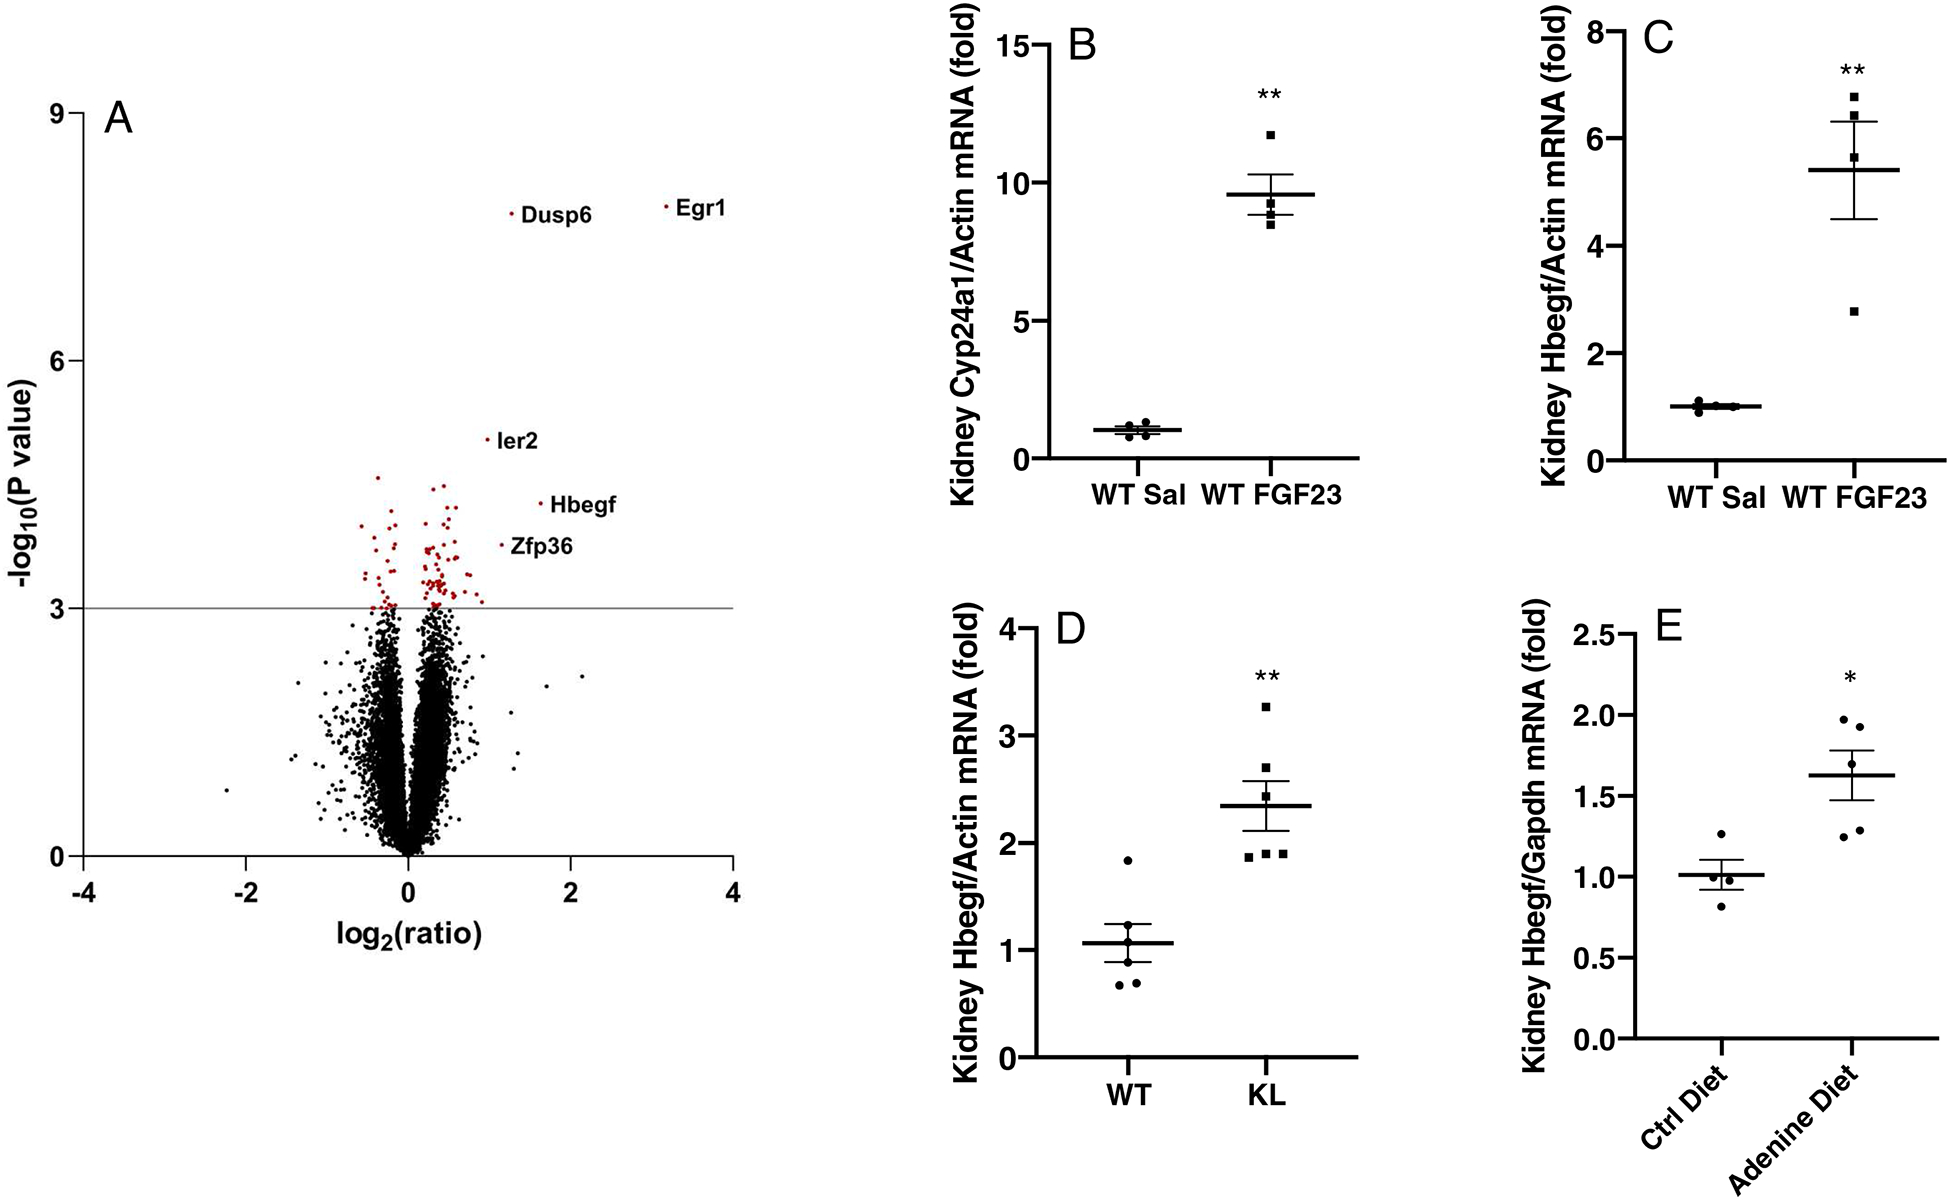
Figure 1. Renal gene expression changes following FGF23 administration and in an FGF23 resistant state.

(A) Volcano-plot for microarray analysis, with Y-axis being −log10(P value) and X axis being log2(ratio). A value of P<0.001 was set as the criteria to select significantly changed genes; dots highlighted in red. The top 5 up-regulated genes were labeled with their gene names in the graph. (B-C) 1h FGF23 administration resulted in a significant increase of renal Cyp24a1 and Hbegf mRNA expression. (D) Kidney Hbegf mRNA levels were elevated in the KL knock-out mouse model and in (E) kidneys from an adenine diet induced CKD mouse model (* P<0.05, **P<0.01 versus control group. N= 4–6. ‘WT’, wild type mice. ‘KL’, KL-null).
