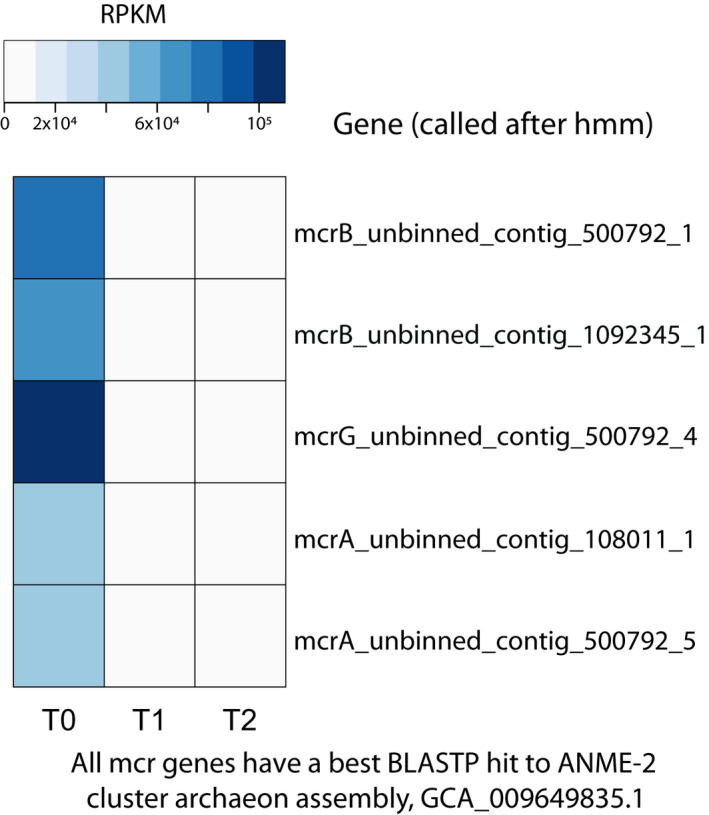
FIGURE A2.

Heat map of mcr genes in the three metagenomes (T0, T1, and T2). RPKM values were calculated from read mapping with BBMap and imported into RStudio for heat map construction. Protein sequences were used for blastp against the NCBI RefSeq database
