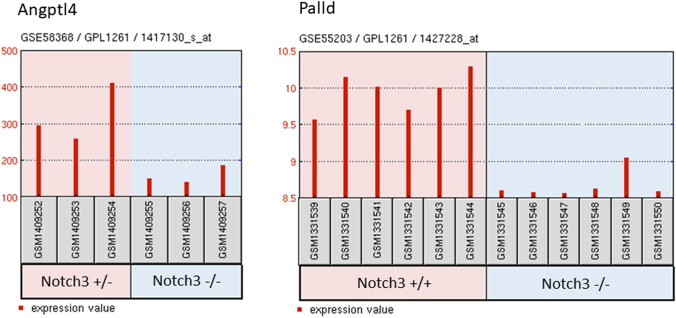
Fig. 2.
Gene expression profiles GSE58368 and GSE55203 of Palld and Angptl4. Datasets were downloaded from the Gene Expression Omnibus (GEO) database. Data derived from GSE58368, show Angptl4 gene expression in brain derived smooth muscle cells from from Notch3 heterozygote mice (Notch3 ±) compared to cells from Notch3 KO (Notch3 −/−) mice. Data derived from GSE55203 show Palld gene expression in brain microvascular fragments from Notch3 KO (Notch3 −/−) mice compared to those from wild-type (Notch3 + / +) mice

