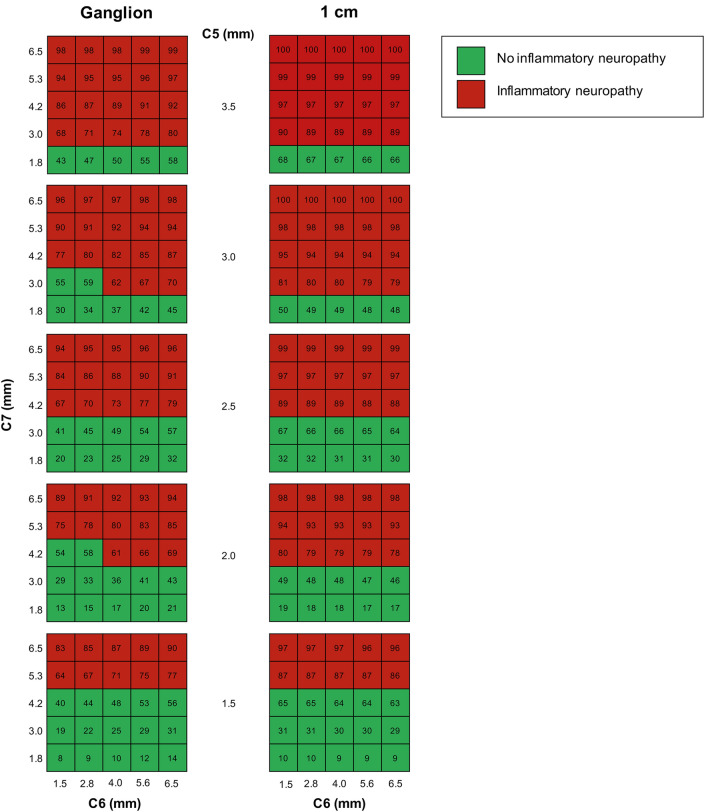
Fig. 3.
Risk chart for predicting CIDP or MMN based on nerve root sizes. Risk charts for measurements next to the ganglion (left panels) and 1 cm distal from the ganglion (right panels). The risk chart provides the absolute risk of having CIDP or MMN based on different combinations of nerve root thickness of nerve root C5, C6 and C7. Every cell of the table contains the probability of having CIDP or MMN (e.g. for measurements next to the ganglion (left panels): if C5 is 1.5 mm, C6 is 1.5 mm and C7 is 1.8 mm, the probability of having CIDP or MMN is 8%). A probability of ≥ 61% for measurements next to the ganglion and ≥ 69% for measurements 1 cm distal from the ganglion were considered abnormal (cells in red). The axes range between the 95% lowest and highest measurements

