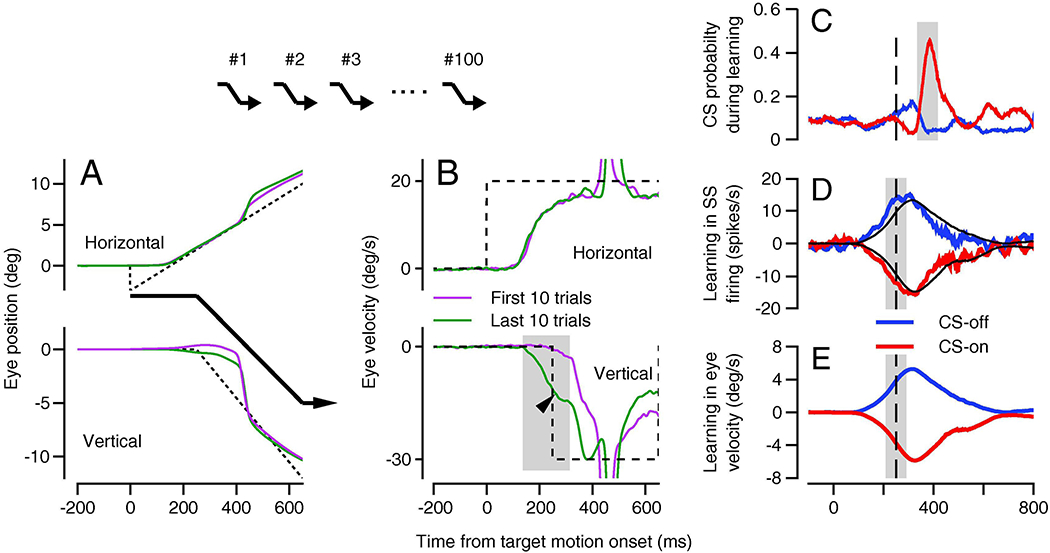
Figure 2. Paradigm for direction learning in smooth pursuit eye movements of monkeys and its neural correlates in the floccular complex of the cerebellum.

A: Horizontal and vertical position traces with the trajectory of the target motion shown by the black arrows. B: Horizontal and vertical eye velocity traces. In A and B, green and magenta traces show averages across the first and last 10 learning trials in a 100-trial block and the dashed traces show target motion. The arrow head indicates the learned eye velocity and the gray shading indicates the interval used to quantify learning. In A and B, negative values of vertical eye motion indicate the learning direction. The arrows above A and B indicate the sequence of learning trials for this kind of experiment. C: Complex-spike probability for Purkinje cells as a function of time. D, E: Learned simple-spike firing and eye velocity after 100 repetitions of the same learning trial. In C-E, the vertical dashed line shows the time of the instruction and the shaded areas indicate the intervals used to quantify responses. Red and blue traces show data for instructions in the directions that caused increases versus decreases in complex-spike probability. Panels A and B are modified from Yang and Lisberger (2017) and C-E are reproduced from Medina and Lisberger (2008), all with permission.
