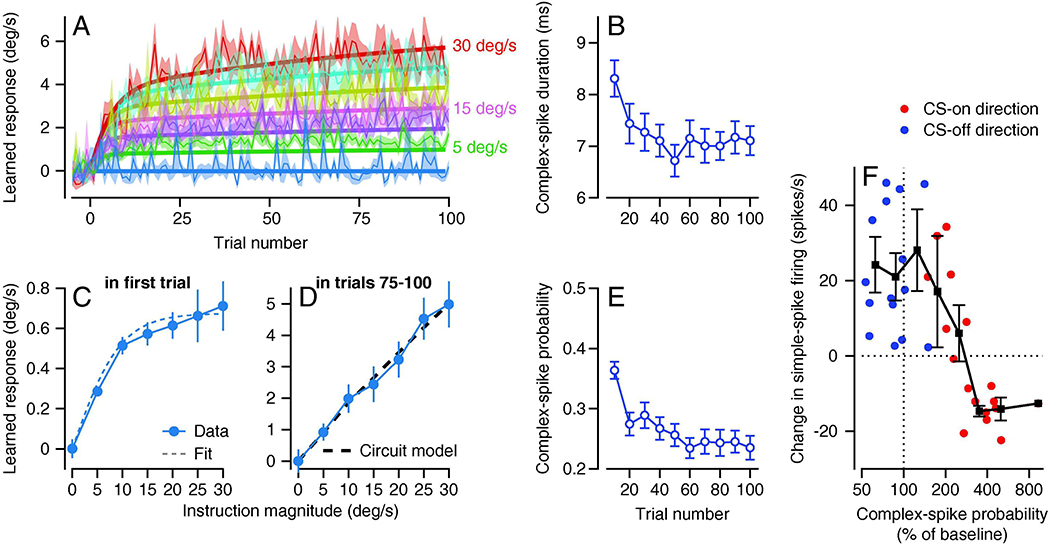
Figure 4. Evidence that recurrent feedback to inferior olive limits the magnitude of behavioral learning.

A: Trial course of behavioral learning over 100 trials. Different colors show learning curves for different speeds of instructive target motion, ranging from 0 to 30 deg/s in 5 deg/s steps. Bold curves show predictions of a computational model that includes recurrent feedback. Fine curves show data and ribbons show ±1 SEM. B, E: Duration and probability of complex-spikes decrease over 100 repetitions of the same learning trial. C, D: Learned response as a function of instruction speed in first trial and in last 25 trials of a 100-trial learning block. Dashed line in C shows a fit to the data for single-trial learning that sets parameters in the model with recurrent feedback that produces the prediction shown by the dashed line in D. F: The magnitude of neural learning after 100 learning trials in different Purkinje cells and for on-versus off-directions of instruction, as a function of the probability of complex-spikes. Each red or blue symbol summarizes data from a single Purkinje cell and the connected black symbols show binned means and standard deviations. CS-on and CS-off refer to the directions that caused increases versus decreases in the probability of complex-spikes. Note that the group of red symbols plotted above the horizontal dashed line summarize a group of Purkinje cells that had low probability of complex-spikes for the preferred direction instruction (CS-on) and showed “wrong-way” learning in simple-spike responses. Panels A, C, and D are reproduced from Herzfeld et al. (2020), B and E from Yang and Lisberger (2017) and F from Medina and Lisberger (2008), all with permission.
