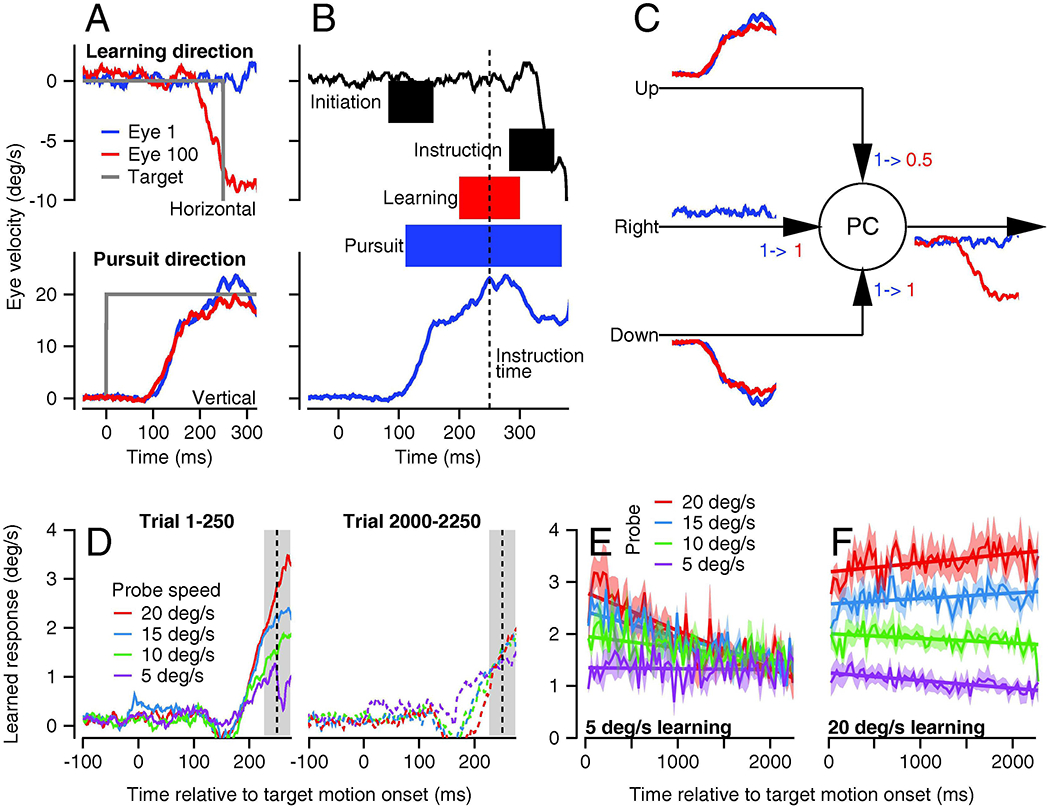
Figure 6: Analysis of functional properties of signals that undergo plasticity.

A: Blue and red traces show eye velocities on the 1st and 100th repetitions of the same learning trial. Traces in A end before any eye velocity response to the instruction. B: Events on first learning trial from A, expanded in time and extended to include the initial eye velocity response to the instruction. Gray and pale blue shading indicate the time intervals when neural signals related to the visual error or eye velocity in the pursuit direction would be available for plasticity. Pale red shading indicates the interval when learning is expressed. Vertical dashed line shows the time of the instructive change in target direction. C: Cartoon showing the signals available on parallel fiber inputs to PCs on the 1st and 100th learning trial, to motivate discussion of which signals are potentially subjected to plasticity. The numbers with arrows (“1->1” and “1->0.5”) indicate changes in the weights of the three parallel fiber inputs to the model Purkinje cell before versus after learning. D: Eye velocity trajectory early versus late in a long learning block. Different colors show expression of learning when the pursuit speed in the probe trial was 5, 10, 15, or 20 deg/s. Pursuit and instruction speeds in all learning trials were 5 and 30 deg/s. E, F: Evolution of generalization of the learned response for pursuit speeds of 5 versus 20 deg/s in the instruction trials. Different colors show learning expression curves for different pursuit speeds in the probe trial. A and B were adapted from Yang and Lisberger (2017). D-F were reproduced from Herzfeld et al. (2020), all with permission.
