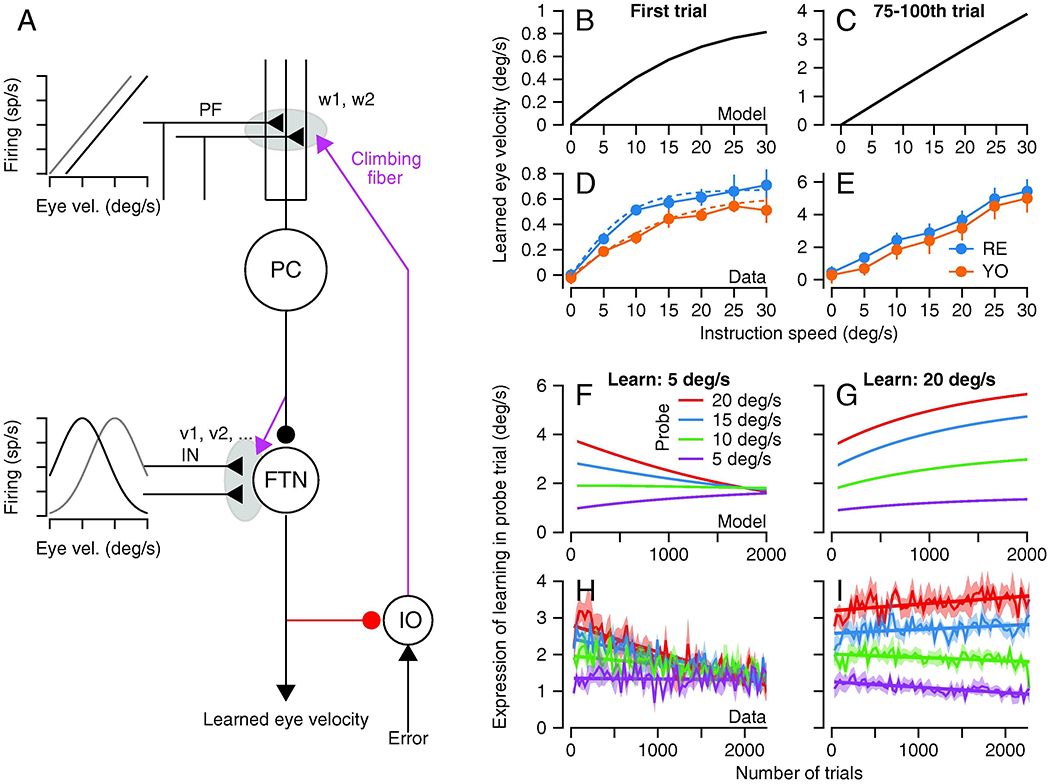
Figure 7. Computational model of the pursuit learning circuit.

A: The structure of the model and the abbreviations are the same as in Figure 1. The two graphs show the proposed relationship to eye movements of the inputs that are subjected to plasticity in the cerebellar cortex and the cerebellar nucleus of the floccular target neurons. B-E: Relationship between size of learned eye velocity and instruction speed for model (B, C) and data (D, E), for single trial learning (B, D) or after 75-100 trials of learning with the same instruction (C, E). F-I: Generalization of learning measured in probe trials with different pursuit speeds as a function of the number of trials in the learning block. Different graphs show results for the model (F, G) and the data (H, I) when the pursuit speed in the learning trial was 5 deg/s (F, H) or 20 deg/s (G, I). The figure is modified from Herzfeld et al. (2020), with permission.
