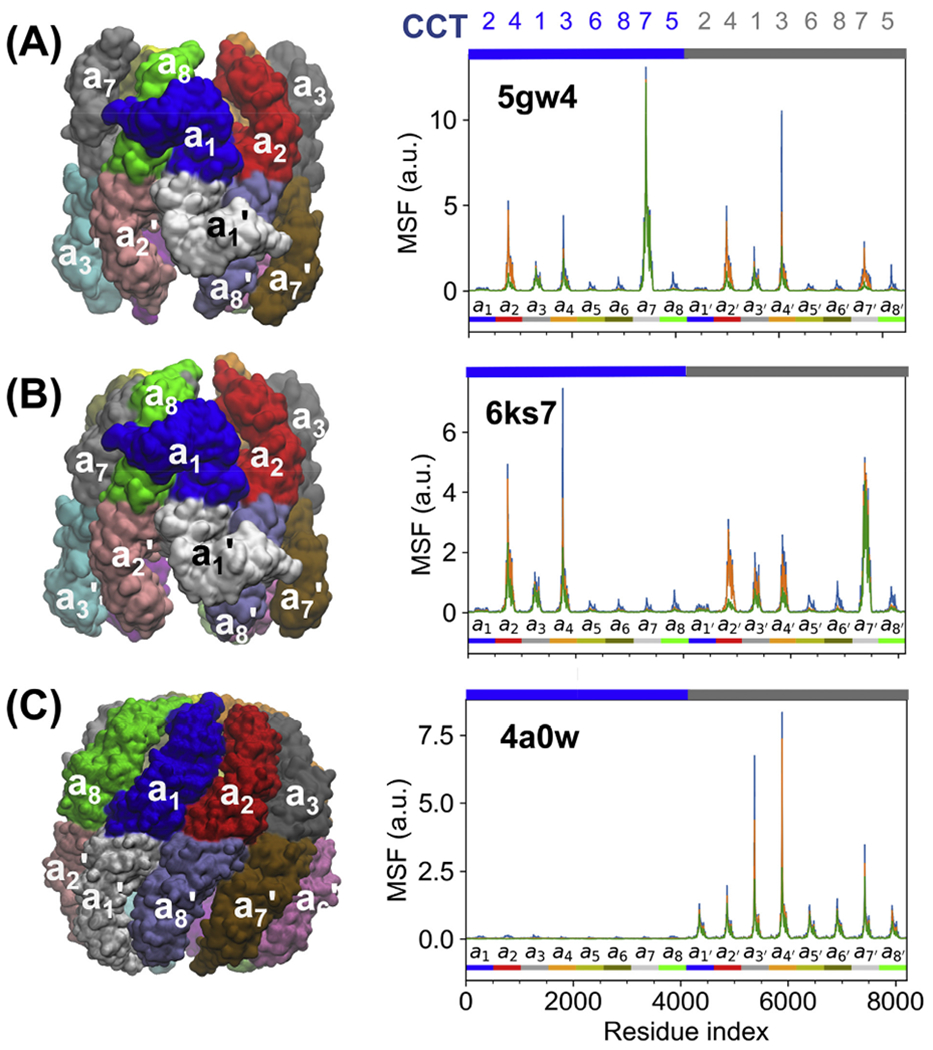
Fig. 4. Different conformational states of TRiC visited during its allosteric cycle and corresponding mobility profiles.

Panels A and B display results for intermediate structures between apo and ATP-bound forms, namely (A) ADP partially preloaded form (PDB: 5gw4) and (B) Conformation 1 at 0.1 mM ADP-AlFx concentration (PDB: 6ks7). Panel C shows TRiC at 1 mM ADP-AlFx (an intermediate stabilized during hydrolysis; PDB: 4a0w). The MSF curves on the right display the movements driven by 5 (green), 10 (orange), and 20 (blue) ANM modes. Labels along the upper abscissa indicate the subunit numbers (CCT1-8). The colour code along the lower abscissa indicates the consecutive subunits, with the colour scheme matching the upper ring on the left.
