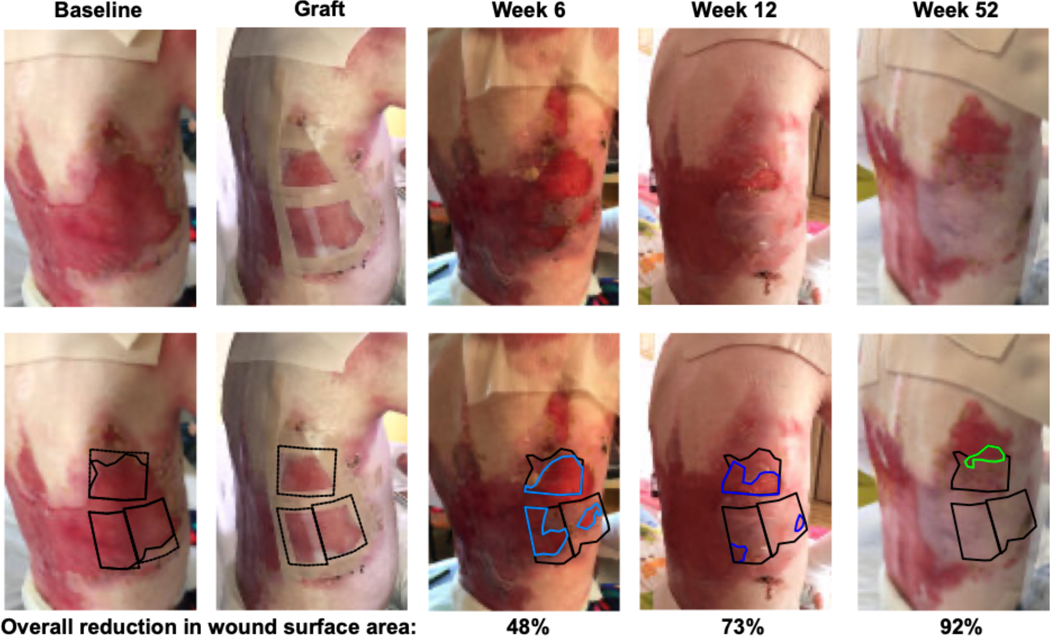
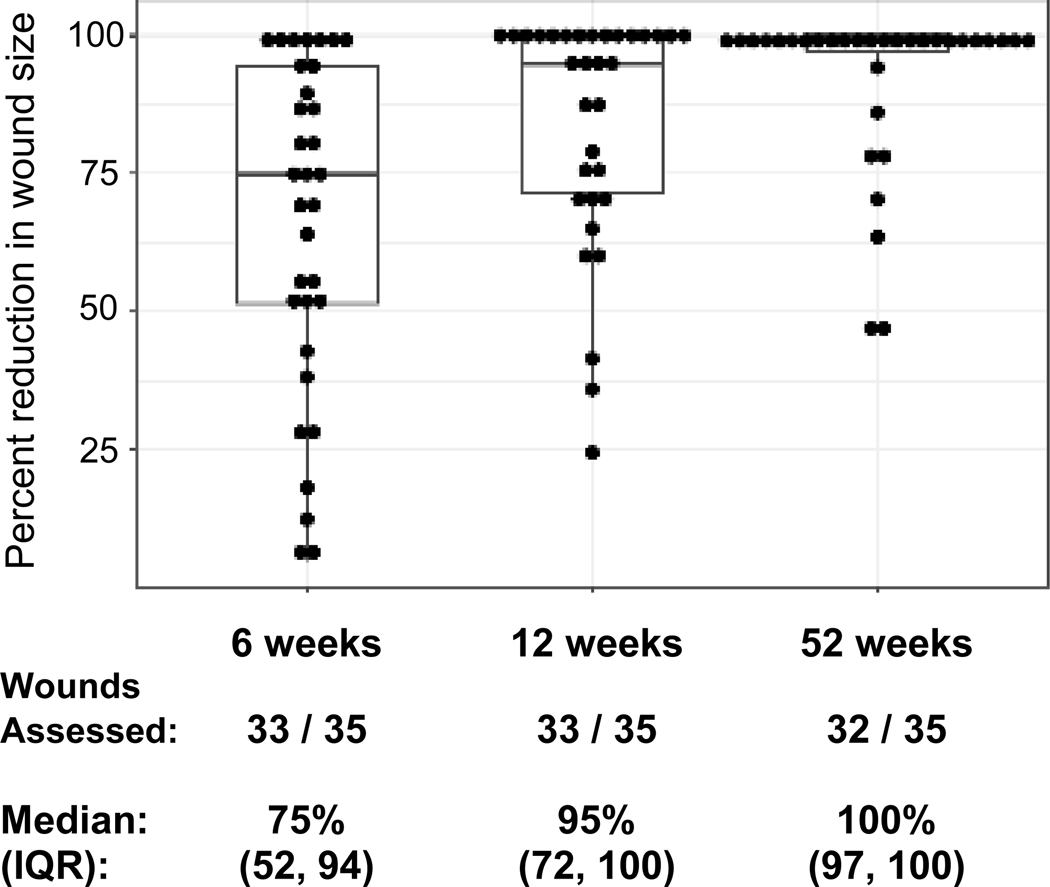
Figure 2. Wound closure with epidermal allografting over one year.

Figure 2a shows a selected example of epidermal allograft placement and wound closure (large back wound of Patient 5), with quantification of wound surface area on replicate images. Black outlines the epidermal graft at baseline/graft placement and open wound available for wound closure beneath the epidermal allograft at all timepoints. Residual wound is outlined in light blue at week 6, dark blue at week 12 and green at week 52. For individual wounds, the percent reduction in wound size over one year following epidermal allografting is displayed in Figure 2b (median and IQR boxplot), statistically significantly reduced at all timepoints compared to baseline, p<0.0001.

