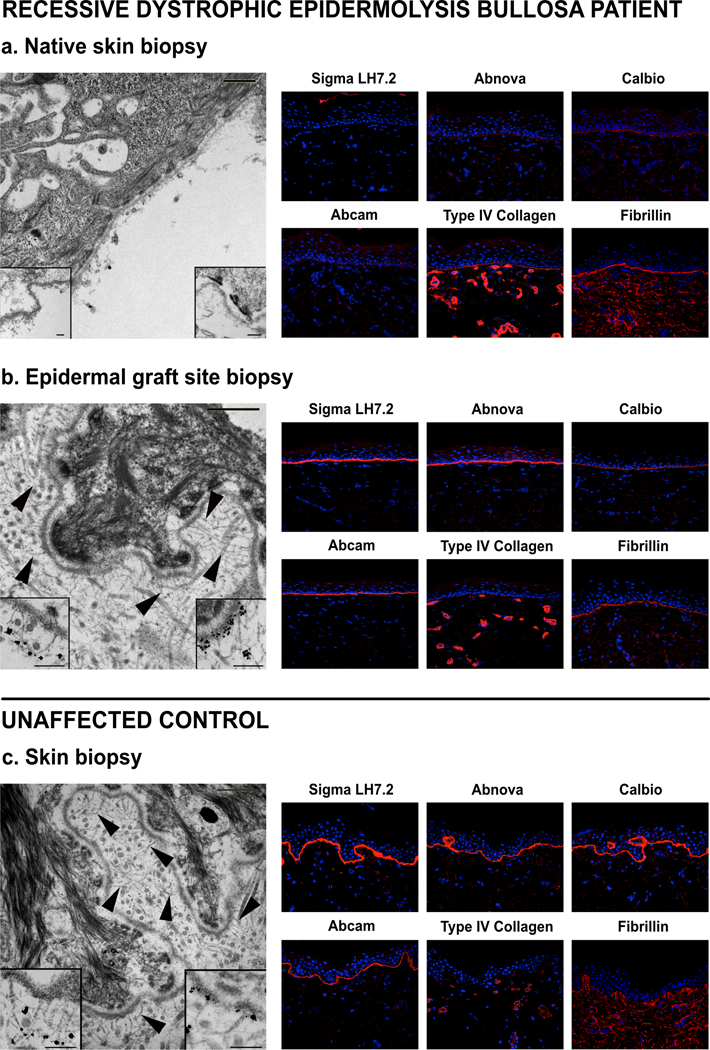
Figure 3. Epidermal allograft microarchitecture resembles control skin with intact C7 and anchoring fibrils at 1-year post-epidermal allograft (two years post-alloHCT).
Skin biopsies of Patient 4 native skin (a) and epidermal graft site (b), compared to an unaffected control (c). Immune electron microscopy images on the left. Main images without immune label, arrows highlight anchoring fibrils, scale bar = 500 nm. Inserts with C7 immunolabels, left lower insert with LH24, right lower insert with mAb185, scale bar = 200 nm. Immunofluorescence images on the right with four C7 antibodies and two control antibodies, Type IV collagen and fibrillin, shown in red and DAPI nuclear staining in blue (40× magnification).

