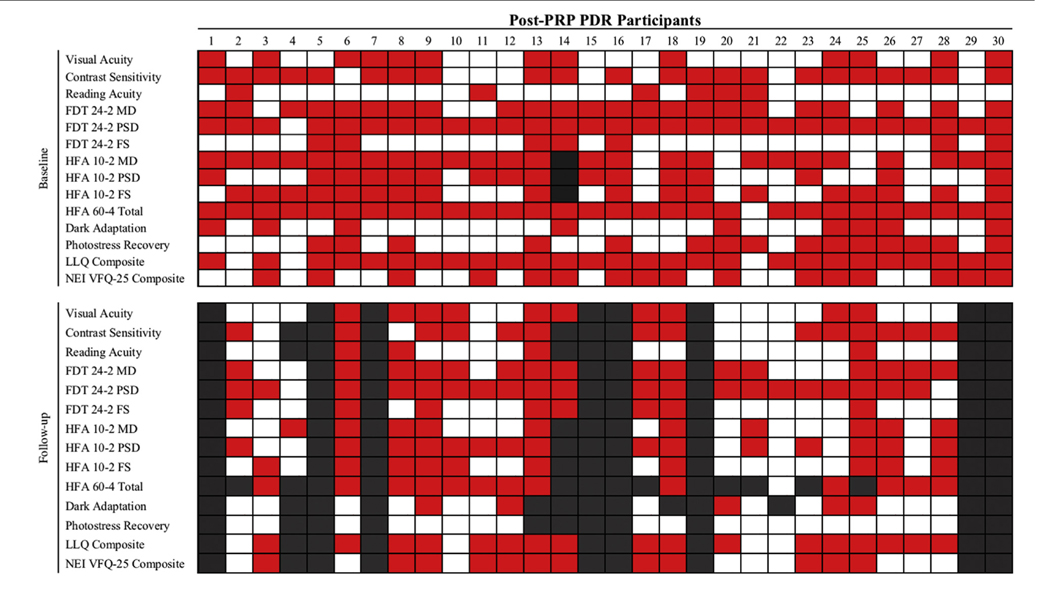
Fig. 1 –
Patients with regressed PDR after PRP who had subnormal performance or patient-reported outcomes. The normal reference range was defined as the mean performance of the control group either plus or minus 2 SD, depending on which direction was considered to worsen performance. Red cells indicate abnormal performance. White cells indicate performance within the reference range. Black cells indicate patients not followed-up. (Reprinted with permission of Association of Research in Vision and Ophthalmology from Chen and Gardner. 37)

