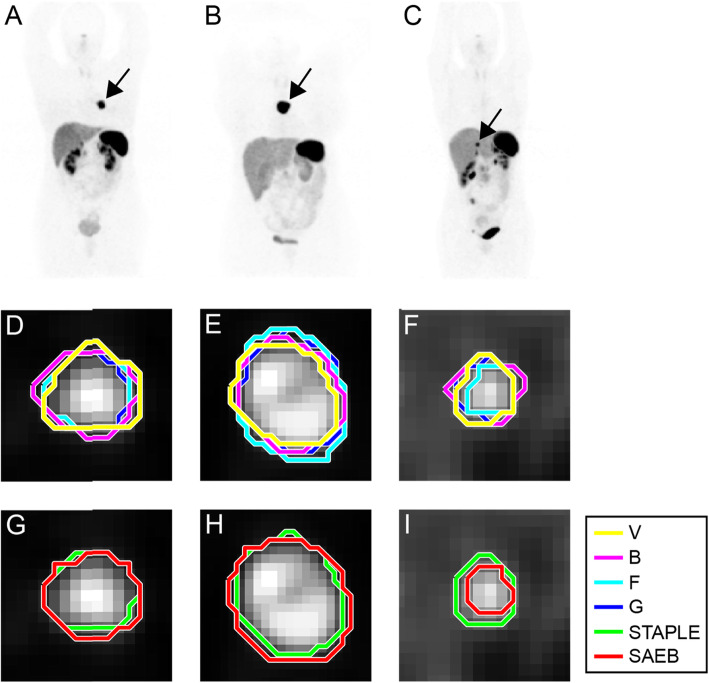
Fig. 3.
Example of segmentation (single slice images) of lesions extracted from three different examined patients. Panels a, d, and g show a lung primary NET; panels b, e, and h show metastatic lesion in a mediastinal lymph node; panels c, f, and i show a metastatic liver lesion. The first row shows the maximum intensity projection (MIP) of 68Ga-DOTATOC of the three different patients where black arrows point at the segmented lesions. In the second row, manual contours performed by the four operators are represented in different colors. The third row shows the STAPLE contour (in green) and the semi-automatic edge-based segmentation (SAEB) algorithm result (in red)

