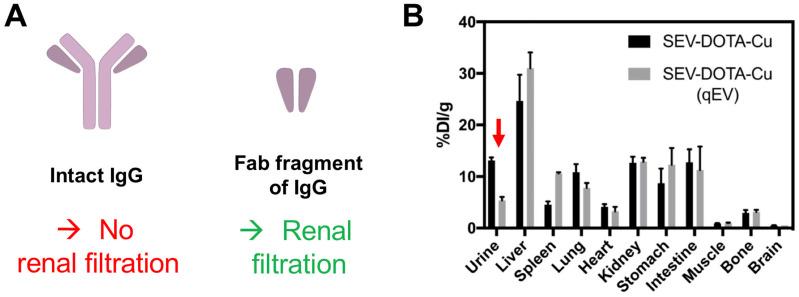
Figure 11.
(A) Schematic structures of an intact IgG antibody (~150 kDa) and its Fab fragment (~50 kDa). (B) Ex vivo biodistribution of 64Cu-labelled sEVs isolated by ultracentrifugation only vs. ultracentrifugation combined with SEC (using a qEV column). Red arrow indicating the difference in urine signal. Figure taken with permission from Banerjee et al. 90.

