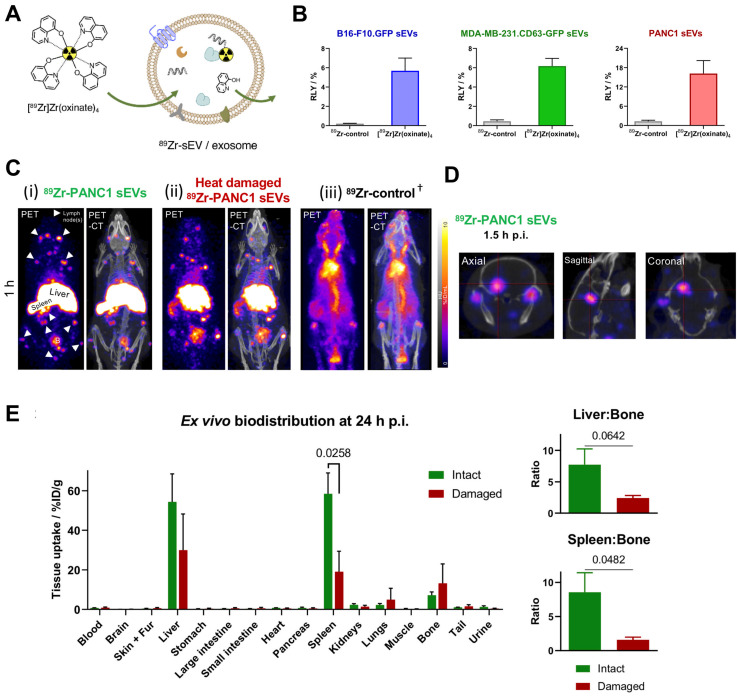
Figure 9.
(A) Schematic representation of intraluminal radiolabelling of sEVs using [89Zr]Zr-oxinate. (B) Radiolabelling yield (RLY) of 1x10¹⁰ B16-F10.GFP sEVs, 1x10¹⁰ MDA-MB-231.CD63-GFP sEVs and 1x10¹¹ PANC1 sEVs; data given as mean ± SD of n = 3. (C) In vivo PET-CT images of C57BL/6 mice injected iv. with 89Zr-PANC1 sEVs, heat-damaged 89Zr-PANC1 sEVs and 89Zr-control, 1 h post injection; B = bladder, † = PET image scale for 89Zr-control is 10 times that of the other images; adjusted for image clarity. (D) Image slices of a mouse injected with intact 89Zr-PANC1 sEVs showing uptake in brain; image scale is the same as in C. (E) Ex vivo biodistribution of “intact” (n = 3) and “heat-damaged” (n=2) 89Zr-PANC1 sEVs. Ratio of liver:bone uptake (n = 3) and spleen:bone uptake (n = 2) is shown on the right; data given as mean ± SD of the n values and analysed by Student's t-test. Figures taken from Khan et al. 93.

