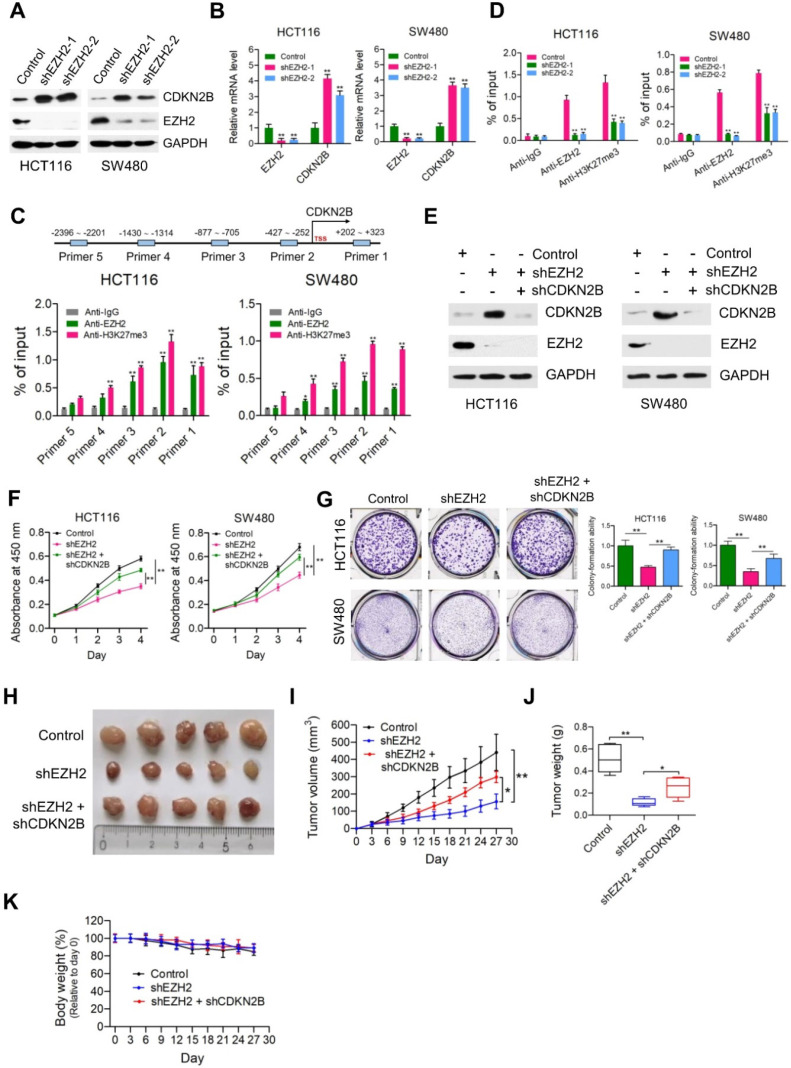
Figure 5.
CDKN2B is a direct transcriptional target of EZH2. (A) Immunoblot analysis of CDKN2B (p15INK4b) expression in HCT116 and SW480 cells stably expressing control, shEZH2-1 and shEZH2-2. GAPDH was used as loading control. (B) Relative mRNA expression of EZH2 was determined by real-time PCR in HCT116 and SW480 cells stably expressing control shRNA (negative control), shEZH2-1 and shEZH2-2. GAPDH was used as an internal control. **P < 0.01. (C) Relative enrichment of EZH2 and its catalytic histone mark H3K27me3 on the promoter region of CDKN2B gene was evaluated by ChIP-qPCR assays in HCT116 and SW480 cells. Primer 1 (+202 ~ +323), Primer 2 (-427 ~ -252), Primer 3 (-877 ~ -705), Primer 4 (-1430 ~ -1314) and Primer 5 (-2396 ~ -2201). IgG was used as a negative control. *P < 0.05, **P < 0.01. (D) Relative enrichment of EZH2 and its catalytic histone mark H3K27me3 on the promoter region of CDKN2B gene (Primer 2: -427 ~ -252) was evaluated by ChIP-qPCR assays in EZH2-depleted HCT116 and SW480 cells. IgG was used as a negative control. **P < 0.01. (E) Immunoblot analysis of EZH2 and CDKN2B (p15INK4b) expression in HCT116 and SW480 cells stably expressing control shRNA, shEZH2 and shEZH2 + shCDKN2B. GAPDH was used as loading control. (F) Cell proliferation of HCT116 and SW480 cells stably expressing control, shEZH2 and shEZH2 + shCDKN2B was evaluated by CCK-8 assay at the same time point of each day. **P < 0.01. (G) Colony formation capabilities of HCT116 and SW480 cells stably expressing control, shEZH2 and shEZH2 + shCDKN2B were performed by plate colony-formation assays. Quantifications are shown on the right panel. **P < 0.01. (H) Representative images of xenograft tumors excised from mice. Control, shEZH2 and shEZH2 + shCDKN2B-treated HCT116 cells were subcutaneously injected into the flank of nude mice. (I) Tumor growth curves of control, shEZH2 and shEZH2 + shEZH2-treated HCT116 xenograft tumors; n = 5. *P < 0.05, **P < 0.01. (J) Tumor weights of control, shEZH2 and shEZH2 + shCDKN2B-treated HCT116 xenograft tumors excised from mice. *P < 0.05, **P < 0.01. (K) Body weight (%, relative to day 0) of mice injected with control, shEZH2 and shEZH2 + shCDKN2B-infected HCT116 cells. Data are presented as means ± SD from three independent experiments.

