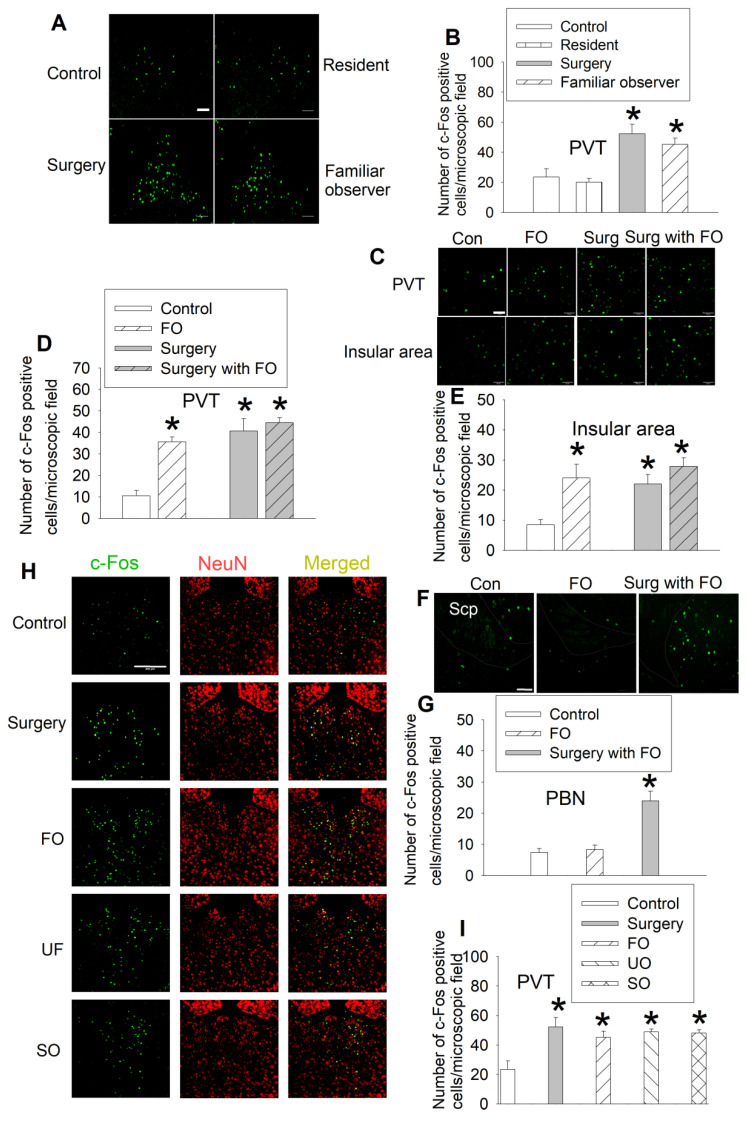
Figure 4.
Familiar observers but not resident mice had increased c-Fos positive cells in special brain regions. Familiar observers or unfamiliar mice were housed in the same cage with surgery mice for 1 h or intruders were housed in the same cage with original resident mice for 1 h. The brain was harvested for immunofluorescent staining. (A) Representative images of c-Fos expression in PVT. Scale bar = 50 µm. (B) Quantification of c-Fos positive cells in PVT. (C) Representative images of c-Fos expression in PVT and insular cortex. Scale bar = 50 µm. (D-E) Quantification of c-Fos positive cells in PVT and insular cortex. (F) Representative images of c-Fos expression in the parabrachial nucleus. The edge of the nucleus is circulated. Scale bar = 100 µm. The inset in each panel is a high magnification microscopic field. (G) Quantification of c-Fos positive cells in the parabrachial nucleus. Scp: superior cerebellar peduncle. Scale bar = 50 µm. (H) Representative images of c-Fos expression in the PVT of various groups. Scale bar = 200 µm. (I) Quantification of c-Fos positive cells in the PVT of various groups. Results are mean ± SEM (n = 5 - 8). * P < 0.05 compared with control. Con: control; FO: familiar observer; PBN: parabrachial nucleus; PVT: paraventricular thalamic nucleus; SO: separated observer; Surg: surgery; UO: unfamiliar observer.

