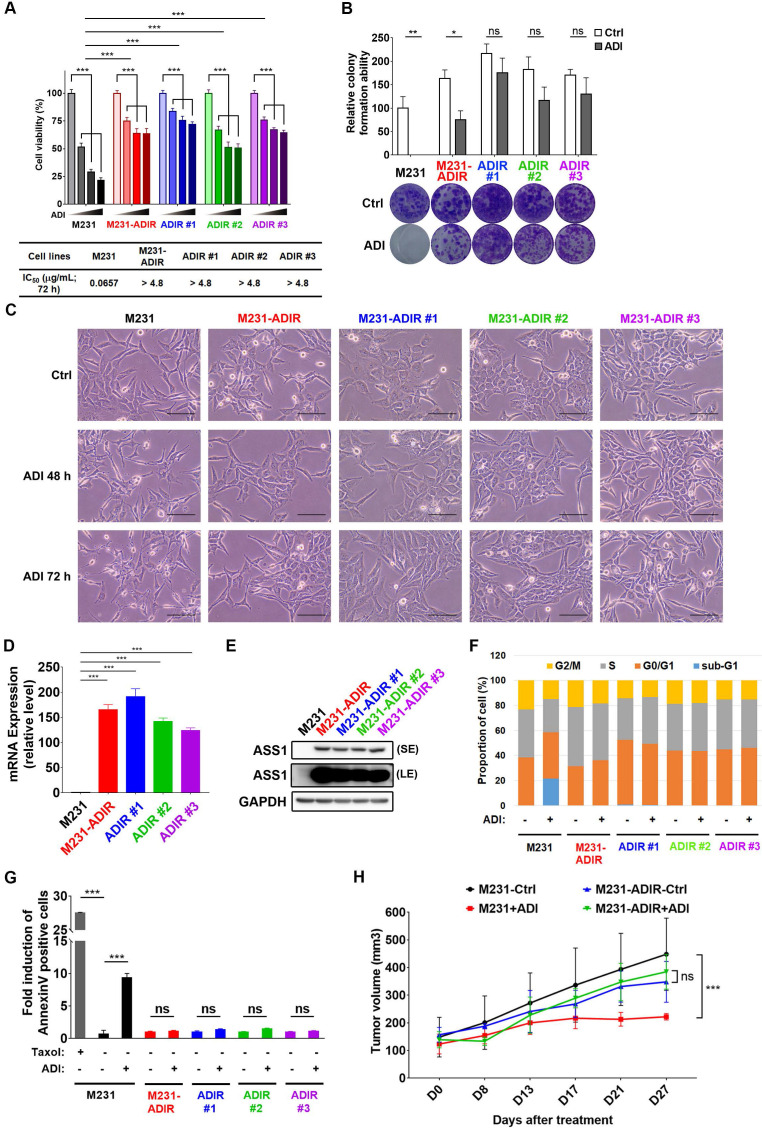
Figure 1.
Development of ADI-PEG20 resistant cells. A, Parental MDA-MB-231 and its ADI-resistant variants (M231-ADIR, M231-ADIR #1, M231-ADIR #2, and M231-ADIR #3) were treated with an increasing dose of ADI (0, 0.075, 0.3, or 1.2 µg/mL) for 3 days. Cell viability of treated cells was measured by MTS assay. IC50 was calculated and listed. B, Clonogenic assay performed in indicated cells treated with vehicle or ADI at 0.3 µg/mL for 14 days. Top panel: Colonies were quantified as percentage inhibition of colony formation. Bottom panel: Representative clonogenic plates were photographed. C, Conventional light microscopy of indicated cells exposed to vehicle or 0.3 µg/mL ADI for 48 h or 72 h. Scale bar, 100 µm. D, mRNA levels of ASS1 in indicated cells were measured by real-time PCR. E, Immunoblotting assays for ASS1 (LE, long exposure; SE, short exposure) and GAPDH in indicated cells. F, Flow cytometry analysis of the effect of ADI treatment (0.3 μg/mL) on the cell cycle in indicated cells for 3 days. Data shown represent quantification of cell cycle analysis. G, Apoptosis was analyzed by flow cytometry for Annexin V. Data shown represent mean ± SD (percentage of apoptotic cells relative to vehicle control) in indicated cells. H, M231 and M231-ADIR cells were injected subcutaneously into BALB/c nude mice. Intraperitoneal injection with vehicle versus ADI 11.5 mg/kg twice a week was commenced two weeks following implantation. Tumor volume of mice xenograft was monitored at indicated time points. All data are shown as mean ± SD of triplicate measurements, with P values from the Student t-test. ***, P < 0.001.

