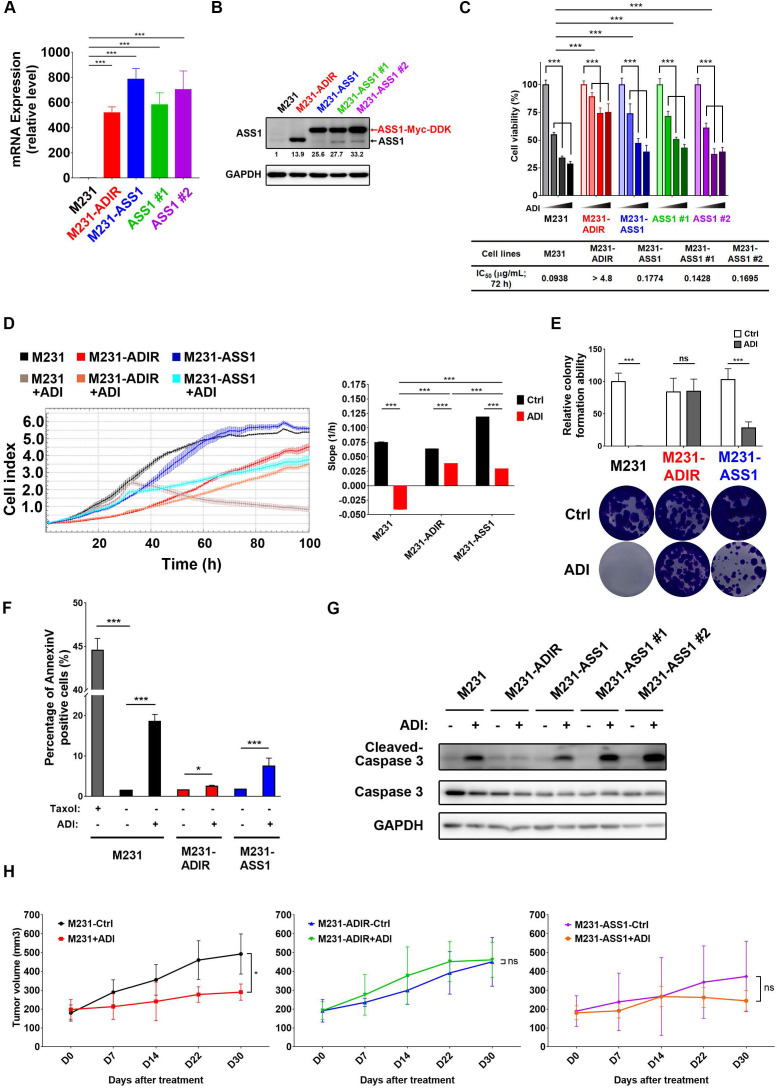
Figure 2.
ASS1 overexpression is not sufficient for ADI-resistance. A, mRNA levels of ASS1 in parental M231, M231-ADIR, and ASS1-overexpressing (M231-ASS1, M231-ASS1 #1, and M231-ASS1 #2) cells were measured by real-time PCR. B, Immunoblotting assays for ASS1 and GAPDH in indicated cells. The protein bands were quantitated by densitometry, expressed relative to GAPDH, and normalized to the parental M231 cells. C, Indicated cells were treated with an increasing dose of ADI (0, 0.075, 0.3, or 1.2 µg/mL) for 3 days. Cell viability of treated cells was measured by MTS assay. IC50 was calculated and listed. D, Cell proliferation of indicated cells treated with vehicle or ADI at 0.15 µg/mL at 24 h were measured by RTCA assay. Left panel: real-time cell index generated by RTCA software. Right panel: slope of the line between the 40 and 60 h interval (changes in cell index/hour). E, Clonogenic assay performed in indicated cells treated with vehicle or ADI at 0.3 µg/mL for 14 days. Top: Representative clonogenic plates were photographed. Bottom: Colonies were quantified as percentage inhibition of colony formation. F, Apoptosis was analyzed by flow cytometry for Annexin V. Data shown represent mean ± SD (percentage of apoptotic cells relative to vehicle control) in indicated cells. G, Immunoblotting assays of cleaved caspase-3, pro-caspase-3, and GAPDH in indicated cells upon treatment of ADI at 0.3 µg/mL for 48 h. H, M231, M231-ADIR, and M231-ASS1 cells were injected subcutaneously into BALB/c nude mice. Intraperitoneal injection with vehicle versus ADI 11.5 mg/kg twice a week was commenced two weeks following implantation. Tumor volume of mice xenograft was monitored at indicated time points. All data are shown as mean ± SD of triplicate measurements, with P values from the Student t-test. *, P < 0.05; **, P < 0.01; ***, P < 0.001; n.s., not significant.

