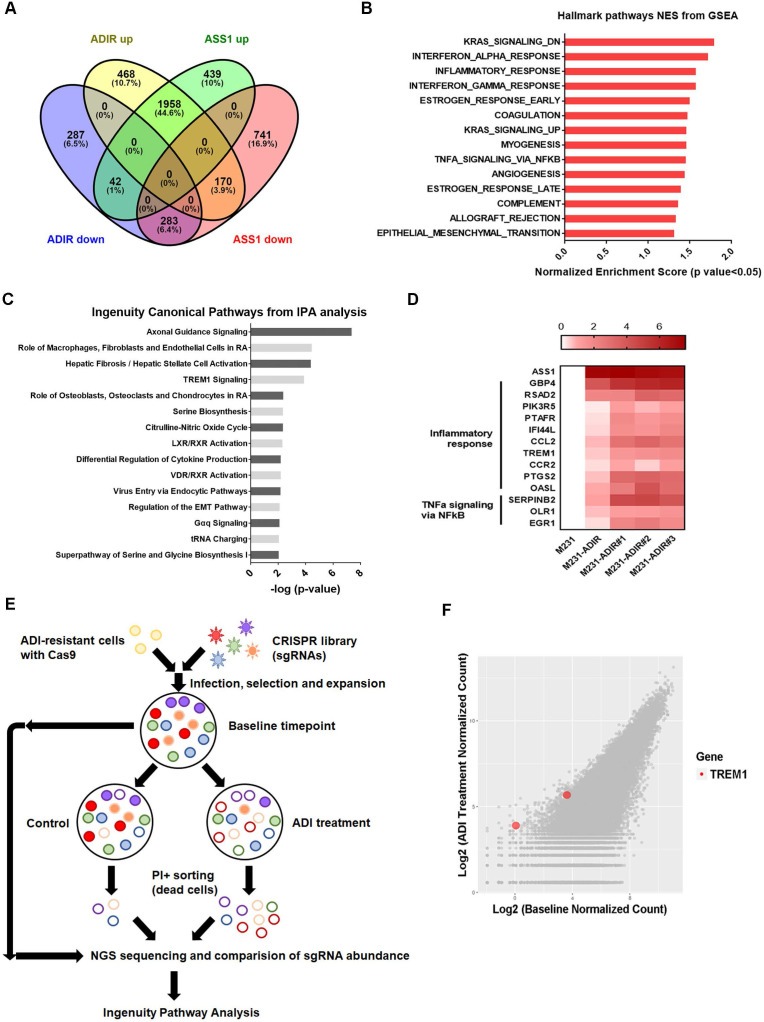
Figure 3.
Immune response is upregulated in ADI-resistance. A, Venn diagram indicating overlapping differentially expressed gene (DEG) sets among ADIR-up (M231-ADIR vs. M231, upregulated), ADIR-down (M231-ADIR vs. M231, downregulated), ASS1-up (M231-ASS1 vs. M231, upregulated), and ASS1-down (M231-ASS1 vs. M231, downregulated). B, DEGs significantly upregulated in M231-ADIR versus M231 cells analyzed using Hallmark pathway datasets in GSEA. NES (normalized enrichment score) and p-values are given as a bar graph. C, Ingenuity Pathway Analysis. Top ranked canonical pathways (-log(p-value) > 1.30) are shown. D, Heat map representing genes based on expression levels in indicated cells by real-time PCR assay. Levels of up-expression (red) are shown. E, Schematic representation of genome-wide human GeCKO knockout screening in M231-ADIR cells with and without ADI treatment. After next-generation sequencing of the pooled library, the frequency of each sgRNA in baseline and PI+ sorted cells were counted. F, Scatterplot of fold change of sgRNA scores of sorted dead cells after ADI treatment versus baseline cells. sgRNAs targeting TREM1 were marked as red.

