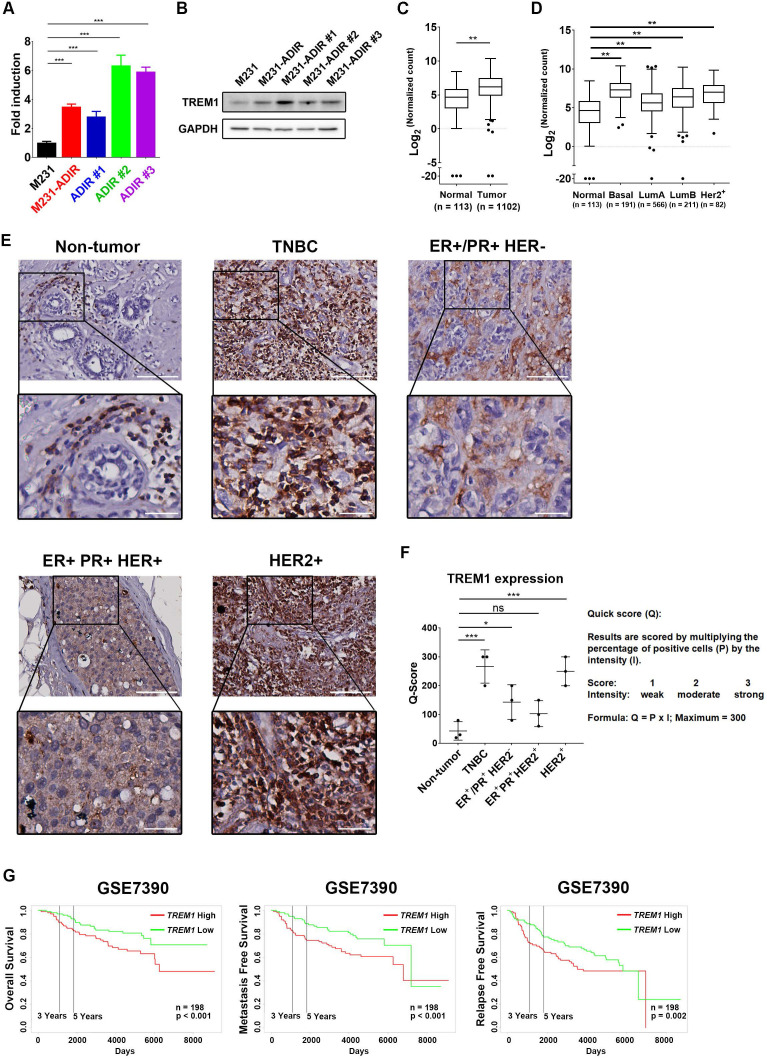
Figure 4.
Participation of TREM1 in breast cancers. A, mRNA levels of TREM1 were measured in indicated cells by real-time PCR. B, Immunoblotting assays for TREM1 and GAPDH in indicated cells. C, Expression levels of TREM1 in breast carcinoma (n = 1102) and normal (n = 113) tissue in TCGA-BRCA cohort. D, Expression levels of TREM1 in different breast cancer subtypes in TCGA-BRCA cohort. Number of samples in each subtype is indicated at the bottom. E, Representative IHC staining of TREM1 signal in different breast cancer subtypes and normal tissue. Scale bar, 100 µm in the original region and 25 µm in the zoomed-in region respectively. F, Intensity of TREM1 signals was quantified as Quick score (Q). G, Kaplan-Meier analysis of overall survival (OS), metastasis-free survival (MFS), and relapse-free survival (RFS) curves of patients with breast cancer (GSE7390; n = 198) stratified by TREM1 expression.

