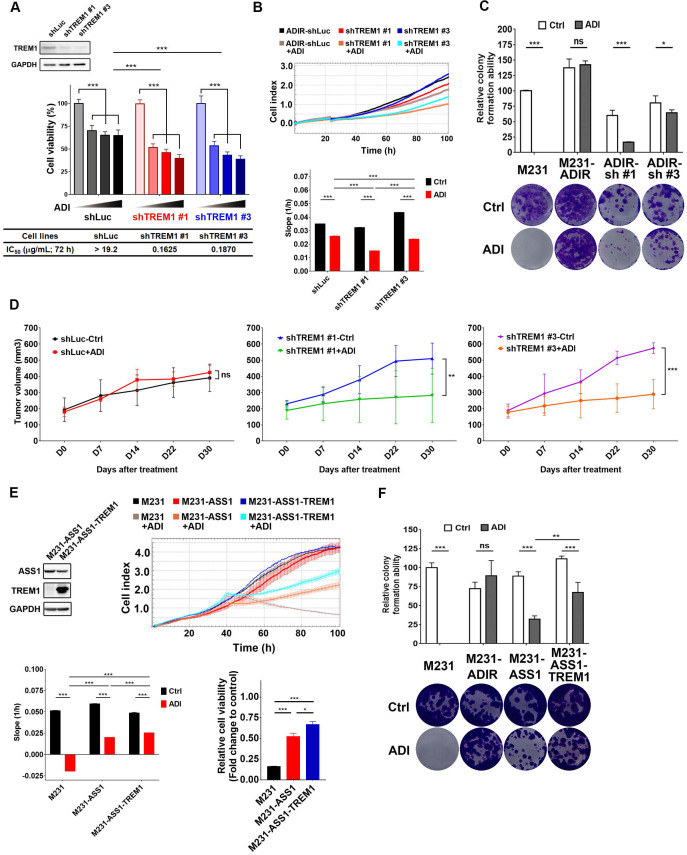
Figure 5.
Participation of TREM1 in ADI-resistance. A, M231-ADIR cells infected with lentiviral vectors encoding shLuc and shTREM1. #1 and #3 indicate distinct shRNAs targeting different regions within TREM1. Knock-down efficiency was checked by immunoblotting assays. Indicated cells were treated with increasing dose of ADI (0, 0.15, 0.3, or 0.6 µg/mL) for 3 days. Cell viability of treated cells was measured by MTS assay. IC50 was calculated and listed. B, Cell proliferation of indicated cells treated with vehicle or ADI at 0.15 µg/mL at 24 h were measured by RTCA assay. Top panel: real-time cell index generated by RTCA software. Bottom panel: slope of the line between the 40 and 60 h interval (changes in cell index/hour). C, Clonogenic assay performed in indicated cells treated with vehicle or ADI at 0.3 µg/mL for 14 days. Top panel: Colonies were quantified as percentage inhibition of colony formation. Bottom panel: Representative clonogenic plates were photographed. D, Indicated cells were injected subcutaneously into BALB/c nude mice. Intraperitoneal injection with vehicle versus ADI 11.5 mg/kg twice a week was commenced two weeks following implantation. Tumor volume of mice xenograft was monitored at indicated time points. E, Top left: immunoblotting assays for ASS1, TREM1, and GAPDH in indicated cells. Top right: cell proliferation of indicated cells treated with vehicle or ADI at 0.15 µg/mL at 24 h was measured by RTCA assay. Real-time cell index generated by RTCA software. Bottom left: slope of the line between the 40 and 60 h interval (changes in cell index/hour). Bottom right: relative cell viability to vehicle control after 72 h treatment. F, Clonogenic assay performed in indicated cells treated with vehicle or ADI at 0.3 µg/mL for 14 days. Top panel: Colonies were quantified as percentage inhibition of colony formation. Bottom panel: Representative clonogenic plates were photographed. All data are shown as mean ± SD of triplicate measurements with P values from the Student t test. *, P < 0.05; **, P < 0.01; ***, P < 0.001; n.s., not significant.

