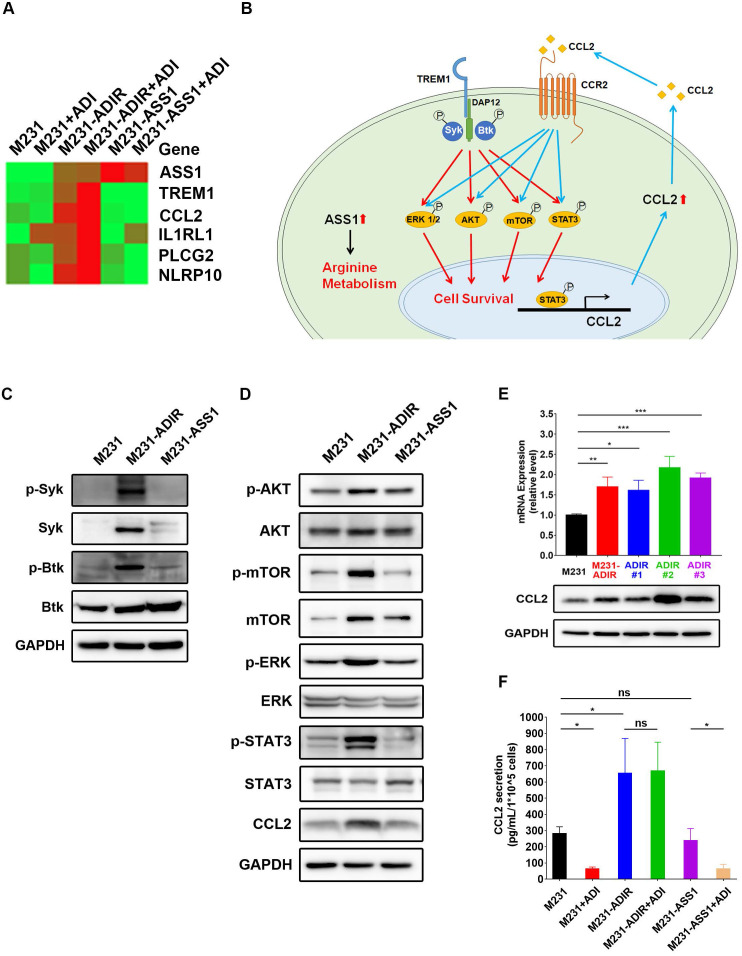
Figure 6.
TREM1 promotes ADI-resistance by activating AKT and mTOR signaling pathways. A, Heat map representing genes based on expression levels in indicated cells with vehicle or ADI at 0.3 µg/mL for 48 h. Levels of down-expression (green) or up-expression (red) are shown. B, Schematic presentation of AKT/ERK/mTOR/STAT3 signaling pathways involved in ADI-resistance. Blue lines represent positive feed-back loops exerted by CCL2. C, Immunoblotting assays for phospho-Syk, Syk, p-Btk, Btk, and GAPDH in indicated cells. D, Immunoblotting assays of protein expressions in indicated cells. E, mRNA (top panel) and protein (bottom panel) levels of CCL2 were measured by real-time PCR and immunoblotting assays respectively in indicated cells. F, Secreted CCL2 in indicated cells were measured by ELISA assay. All data are shown as mean ± SD of triplicate measurements, with P values from the Student t-test. *, P < 0.05; **, P < 0.01; ***, P < 0.001; n.s., not significant.

