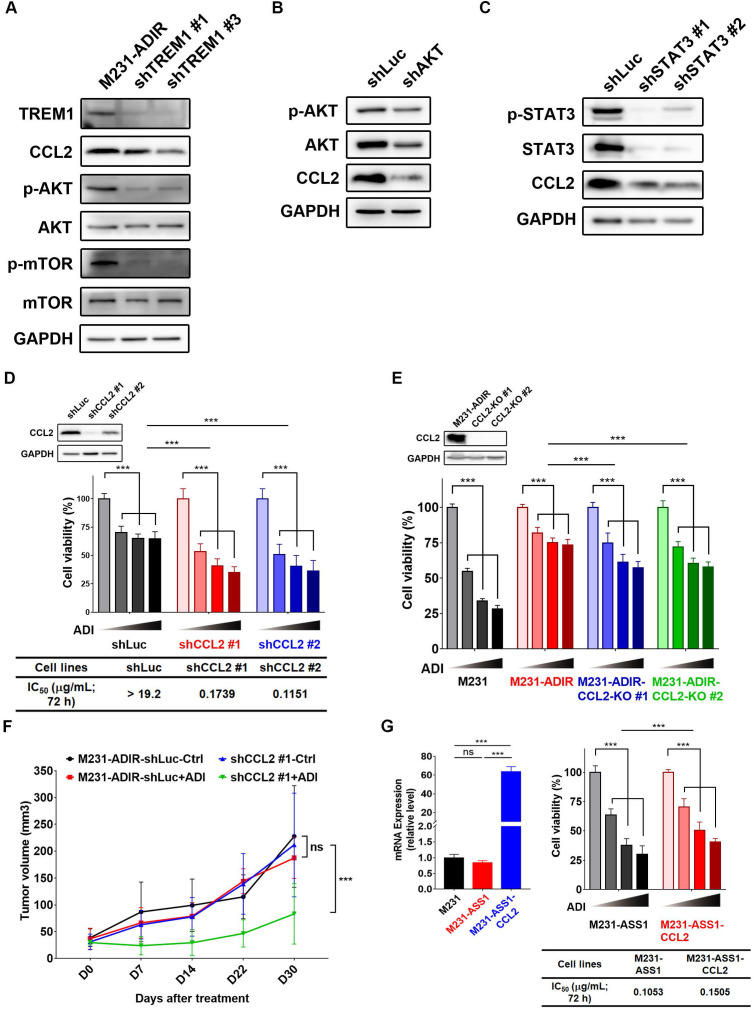
Figure 7.
CCL2 contributes to ADI-resistance as a downstream target of TREM1. A, Immunoblotting assays for TREM1, CCL2, phospho-AKT, AKT, p-mTOR, mTOR, and GAPDH in TREM1-silenced M231-ADIR cells. B, Immunoblotting assays for phospho-AKT, AKT, CCL2, and GAPDH in AKT-silenced M231-ADIR cells. C, Immunoblotting assays for phospho-STAT3, STAT3, CCL2, and GAPDH in STAT3-silenced M231-ADIR cells. D, M231-ADIR cells infected with lentiviral vectors encoding shLuc and shCCL2. #1 and #2 indicate distinct shRNAs targeting different regions within CCL2. Knock down efficiency was checked by immunoblotting assays. Indicated cells were treated with increasing dose of ADI (0, 0.15, 0.3, or 0.6 µg/mL) for 3 days. Cell viability of treated cells was measured by MTS assay. E, Immunoblotting assays were used to validate the expression of CCL2 in CCL2-knockout forms (KO #1 and KO #2). Indicated cells were treated with increasing doses of ADI (0, 0.075, 0.3, or 1.2 µg/mL) for 3 days. Cell viability of treated cells was measured by MTS assay. F, Indicated cells were injected subcutaneously into BALB/c nude mice. Intraperitoneal injection with vehicle versus ADI 11.5 mg/kg twice a week was commenced two weeks following implantation. Tumor volume of mice xenograft was monitored at indicated time points. G, Left panel: mRNA level of CCL2 by real-time PCR assay. Right panel: Indicated cells were treated with increasing dose of ADI (0, 0.075, 0.15, or 0.3 µg/mL) for 3 days. Cell viability of treated cells was measured by MTS assay. IC50 was calculated and listed. All data are shown as mean ± SD of triplicate measurements, with P values from the Student t test. *, P < 0.05; **, P < 0.01; ***, P < 0.001; n.s., not significant.

