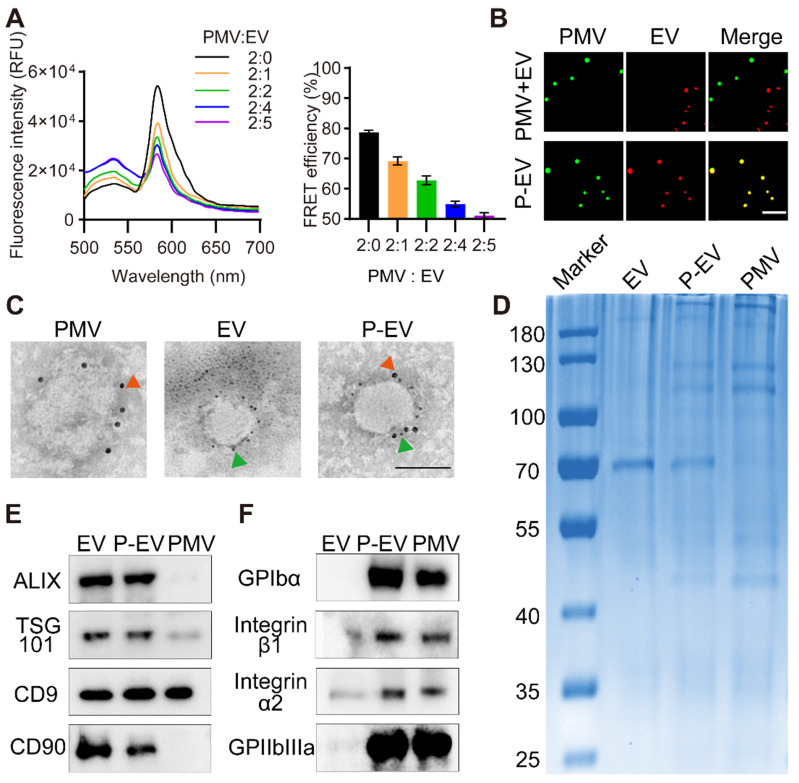
Figure 2.
Membrane fusion study and protein markers characterization. (A) Fluorescence intensity of P-EVs in the FRET study and quantification of FRET efficiency after membrane fusion at different ratio. PMVs labeled with a pair of FRET fluorescent dyes were fused with increasing amounts of EVs. A recovery of fluorescence at 534 nm indicated the fusion of PMVs and EVs (PMV:EV = the protein ratio of platelet membrane to EV). (B) Structured illumination microscopic imaging of either P-EVs or a mixture of PMVs and EVs without extrusion (green: PMV, red: EV). Scale bar = 5 µm. (C) Immunogold TEM images of PMVs, EVs and P-EVs probe for CD90 (green arrows, small gold nanoparticles) and GPIbα (red arrow, large gold nanoparticles). Scale bar = 100 nm. (D) Protein contents of EVs, P-EVs and PMVs on a Coomassie blue stained SDS-PAGE gel. (E) Western blot analysis of Alix, TSG101, CD9 and CD90 expression in EVs, P-EVs and PMVs. (F) Western blot analysis of GP Ibα, integrin α2/β1 and GPIIbIIIa expression in EVs, P-EVs and PMVs. All samples were run at equivalent protein concentrations.

