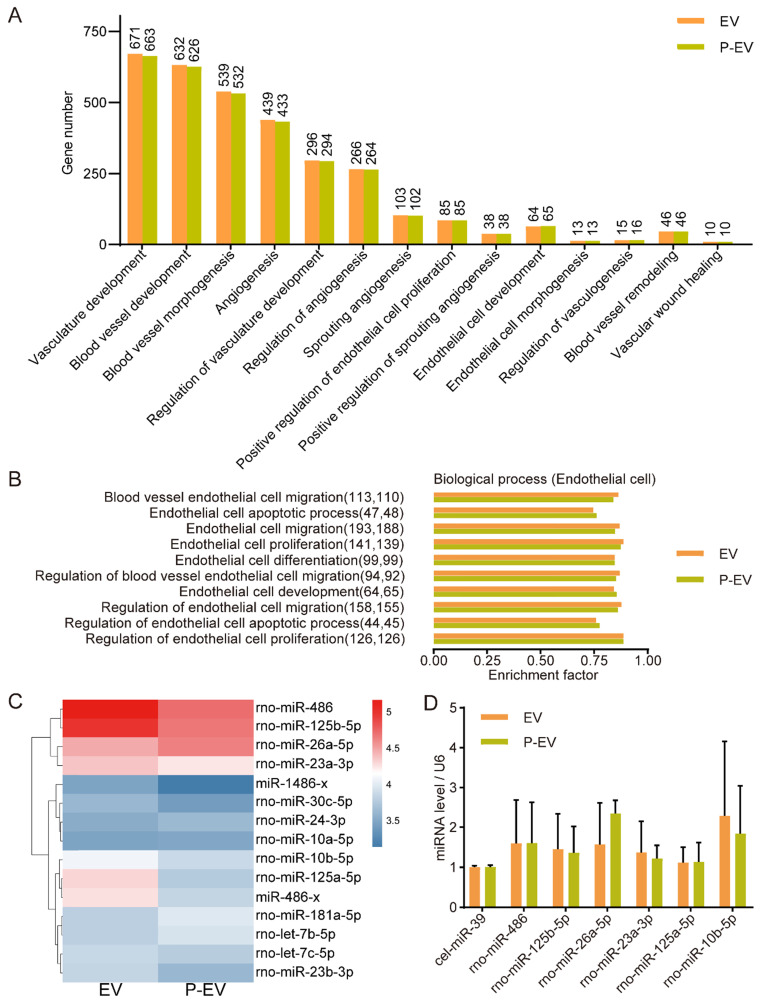
Figure 3.
The miRNA analysis of P-EVs. (A) Gene ontology enrichment analysis of angiogenesis-related genes in the EVs and P-EVs. (B) GO analysis of biological process involved in endothelial cell based on enrichment factor. The numbers in parentheses are the number of genes. (C) Heat map of angio-related miRNAs in EVs group and P-EVs group (blue represented low expression and red represented high expression). (D) Quantification of top 6 angio-related miRNAs expression values in EVs group and P-EVs group by qRT-PCR (n = 3). Data are expressed as mean ± SEM.

