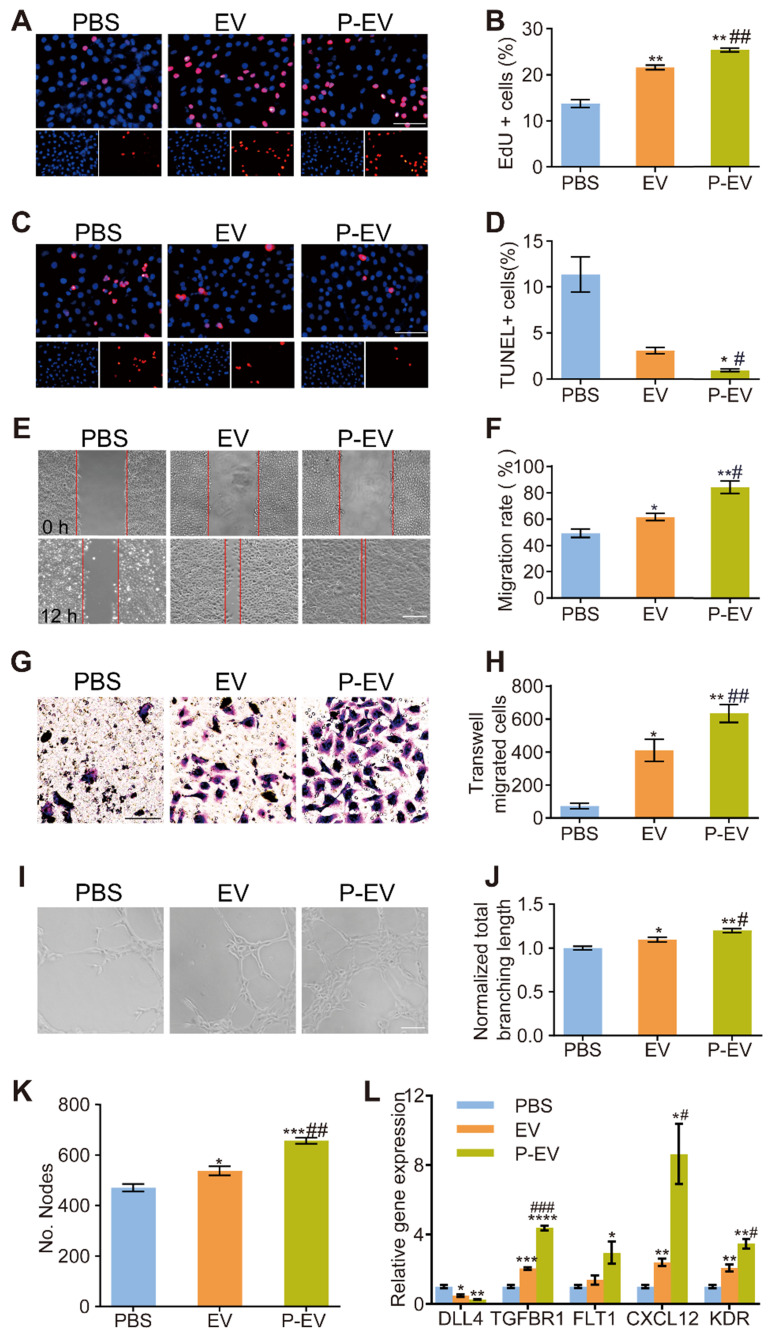
Figure 5.
Pro-angiogenic capacity of P-EVs in vitro. HUVECs were pretreated with PBS, EVs and P-EVs respectively after 24 h hypoxia injury. (A) Representative images of HUVECs proliferation which were determined by EdU incorporation (Scale bar = 100 μm) and (B) the percentage of EdU positive cells. (C) Representative images of HUVECs apoptosis which were determined by TUNEL staining (Scale bar = 100 μm) and (D) the percentage of TUNEL positive cells. (E) Representative images of scratch assay of HUVECs migration (Scale bar = 50 μm) and (F) The quantification of migration area taken at 0 h or 12 h. (G) Representative images of transwell migration assay of HUVECs migration (Scale bar= 50 μm) and (H) the number of transwell-migrated cells. (I) Representative images of tube-like structures and quantitative analysis of the total branching length (J) and the number of nodes (K) (Scale bar = 50 μm). (L) Quantification of angiogenesis related genes levels of HUVECs in each group after 24 h incubation. The values are calculated in at least five random fields. Data are expressed as mean ± SEM (n = 3, */# P < 0.05, **/## P < 0.01, ***/### P < 0.001, * compared with PBS group, # compared with EV group).

