Figure 7.
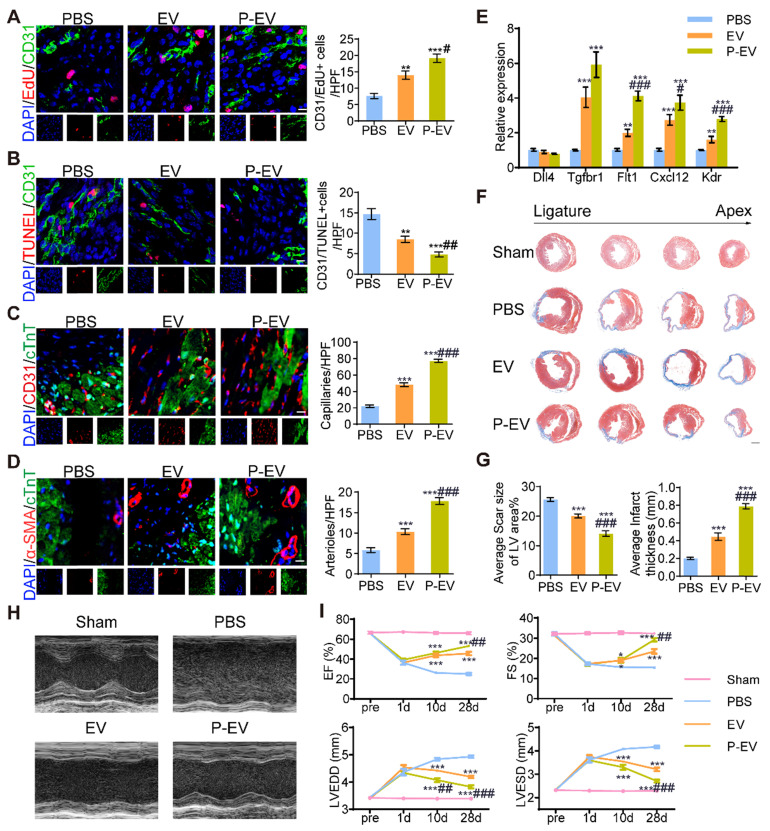
Angiogenesis promotion and cardiac recovery of P-EVs in the infarcted hearts. (A) Representative images of CD31/EdU double positive endothelial cells proliferation in the peri-infarct area of PBS, EVs and P-EVs group after 7 days of treatment and quantitative analysis of CD31/EdU double positive endothelial cells. Scale bar = 10 μm. (B) Representative images of CD31/TUNEL double positive endothelial cells apoptosis in the peri-infarct area after 7 days of treatment and quantitative analysis of CD31/TUNEL double positive endothelial cells. Scale bar = 10 μm. (C) Representative images of capillaries stained with CD31 in the peri-infarct area after 28 days of treatment and quantitative analysis of CD31 positive capillaries. Scale bar = 10 μm. (D) Representative images of arterioles stained with α-SMA in the peri-infarct area after 28 days of treatment and quantitative analysis of α-SMA positive arterioles. Scale bar = 10 μm. (E) Quantification of angiogenesis-related genes levels by qRT-PCR in the hearts of mice at 7 days post-treatment. (F) Representative images of Masson's trichrome stained myocardium sections from ligation site to apex of mice in the sham, PBS, EVs, and P-EVs group after 28 days of treatment. Scale bar= 1 mm. (G) Quantitative analysis of average scar size and infarct wall thickness based on the Masson's trichrome staining. (H) Representative M-mode echocardiograms at day 28 post treatment. (I) The EF, FS, LVEDD and LVESD measured based on the echocardiograms at pre-operation (pre) day, day 1, 10 and 28 post treatment. Data are shown as mean ± SEM (n = 6, */# P < 0.05, **/## P < 0.01, ***/### P < 0.001, * compared with PBS group, # compared with EVs group).

