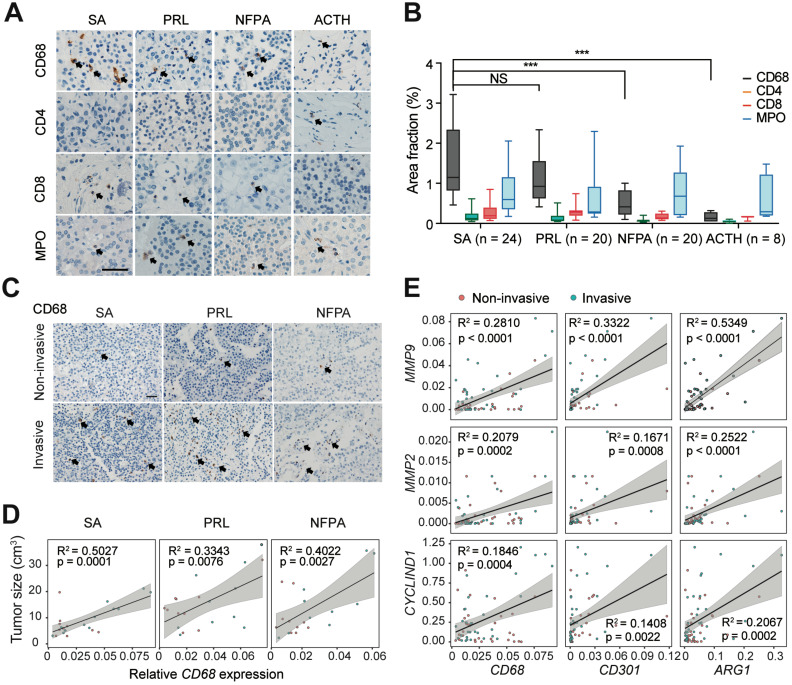
Figure 2.
M2-like TAMs are positively associated with PAs invasion. A and B, Representative images (A) and quantitation of staining percent (B) of human SAs, PRLs, NFPAs, and ACTH adenomas stained with CD68, CD4, CD8, and MPO. Scale bar = 50 µm. (SAs, n = 24; PRLs, n = 20; NFPAs, n = 20; and ACTH adenomas, n = 8). Positive cells are indicated with black arrowheads. Original magnification, ×200. Scale bars, 50 µm. Arrow indicates positive cells. C, Representative images of SA, PRL, and NFPA samples stained with CD68 in invasive PAs versus noninvasive PAs. Positive cells are indicated with black arrowheads. Original magnification, ×200. Scale bars, 50 µm. D, Correlation between CD68 expression levels and tumor size in human SAs, PRLs, and NFPAs. E, mRNA expression of MMP2, MMP9, and CyclinD1 correlated with M2-like TAM markers of (CD68, CD301 and CD206). All t-tests were two-tailed. Mean ± SEM. NS, no significance. *P < 0.05, **P < 0.01, and ***P < 0.001. SAs, somatotroph adenomas; PRLs, prolactinomas; NFPAs, non-functioning pituitary adenomas; ACTH adenomas, ACTH secreting adenomas.

